The PockFlex server
Protein binding sites are inherently dynamic and can vary across different conformations. PockFlex is a flexibility-aware web server designed to track and cluster binding pockets across structural ensembles, with a particular focus on user-defined regions of interest. In PockFlex, a recurrent binding site is defined as a cluster of pockets sharing similar residue composition across multiple conformations. This residue-based definition enables the reconstruction, characterisation, and prioritisation of binding sites while explicitly accounting for structural variability.
PockFlex accepts ensembles of protein PDB structures as input, including molecular dynamics trajectories, sets of experimental structures, or predicted conformations with consistent residue numbering. The workflow integrates pocket detection and druggability prediction using the PockDrug web server (Abi Hussein et al., 2015), tracking across ensembles, and residue-based clustering. This protocol was first applied and validated on biologically relevant systems, including the influenza A virus NS1 RNA-binding domain and the SARS-CoV-2 spike receptor-binding domain (Naceri et al., 2023; Ghoula et al., 2023).
PockFlex identifies pockets independently in each conformation, filters them according to the user-defined region of interest, and clusters them into representative binding sites based on residue similarity. These binding sites are then quantified across the structural ensemble in terms of their occurrence frequency (reflecting the persistence of binding-site clusters across multiple conformations), residue-level stability, and predicted druggability.
By explicitly integrating structural variability into pocket analysis, PockFlex reveals persistent, transient, and rare binding sites that may remain inaccessible in individual static structures, together with their associated residue variability. Users can explore different clustering resolutions and select binding sites according to criteria such as pocket frequency and predicted druggability, as well as their spatial localisation inferred from pocket visualisation and residue-level analysis. The PockFlex server provides interactive visualisation tools, residue-level stability maps, and druggability assessments to support early-stage drug discovery and flexibility-aware binding-site prioritisation.
Pocket Detection and Per-Structure Analysis
For each structure in the ensemble, PockFlex performs the following steps:
- detects binding pockets using the fpocket method,
- extracts pocket geometry and residue composition,
- estimates pocket druggability using the PockDrug model (Abi Hussein et al., 2015),
- filters detected pockets to retain only those including at least one residue from a user-defined region of interest (ROI)
fpocket is a fast, ligand-independent, geometry-based method applicable to both apo and holo proteins, widely used for binding-pocket detection. PockDrug builds on fpocket-derived pocket descriptors to predict pocket druggability using a supervised machine-learning model trained on known drug–target complexes.
Binding-Site assembly (Pocket Clustering)
To identify binding regions recurrently sampled during the simulations, all pockets detected across the structure ensembles are pooled and compared based on their residue composition. Each pocket was encoded as a binary vector indicating the presence or absence of residues, and pocket similarity was quantified using a binary distance metric (distance = 0 for identical residue sets).
Unsupervised hierarchical clustering is then performed using the Ward.D2 linkage criterion, selected to favour compact and homogeneous clusters corresponding to recurrent binding sites defined by stable residue scaffolds. Dendrograms combined with residue-based heatmaps enable the assessment of cluster coherence by revealing similarities and differences between pockets in terms of their residue composition.
This clustering step complements pocket tracking by grouping pockets that converge toward similar residue-defined structural regions, thereby linking pockets observed in different conformations or time points to common binding-site locations.
To ensure statistical robustness and meaningful interpretation, clustering solutions are restricted to those containing at least 30 pockets per cluster, and small pockets with less than 8 residues are not considered. Importantly, clustering is performed exclusively on pockets that include at least one residue from the user-defined region of interest (ROI), ensuring that the analysis targets binding pockets associated with the region of interest, instead of treating the region as a static surface area.
User Guide: How to interpret and prioritise binding sites with PockFlex
Step 1: Identify recurrent binding-site candidates
Guiding question: Which sites are repeatedly observed across the ensemble?
Begin with the Results Viewer: Global Overview to assess how often pockets are detected across conformations. At this stage, occurrence frequency acts as a first-level filter.
Interpretation guide:
- Highly frequent sites are more likely to correspond to robust and functionally relevant binding sites.
- Rare or sporadic sites may reflect transient, cryptic, or noise-driven pockets.
As a practical guideline, binding-site occurrence, or occupancy of the structural ensemble, can be interpreted as follows: ~50% of conformations → persistent site, ~20–50% → flexible but recurrent site, < ~20% → transient or secondary site. Frequency provides a first filter to distinguish robust structural features from occasional events. These thresholds are indicative and system-dependent.
Step 2: Assess cluster coherence and stability
Guiding question: Do the pockets forming this site share a consistent residue scaffold?
For each candidate, inspect the cluster-level heatmaps and dendrograms. Compact dendrograms and consistent residue patterns indicate well-defined binding sites.
Structural heterogeneity should be interpreted with caution. Moderate variability reflects low binding-site plasticity induced by protein dynamics. Strong heterogeneity may reflect genuine binding-site flexibility driven by protein motions that alter pocket geometry, or indicate that a cluster aggregates pockets sharing only a limited set of common atoms or residues. In the latter case, further cluster refinement or subdivision may be warranted.
Step 3: Evaluate druggability robustness
Guiding question: Does this site remain druggable across conformational states?
Using cluster-level druggability statistics, examine the proportion and distribution of druggable pockets within each cluster. Clusters dominated by druggable pockets indicate sites whose physicochemical properties remain favourable despite conformational changes.
Key message: Consistently druggable clusters represent robust targets for structure-based drug design.
Step 4: Identify key residues shaping the binding site
Guiding question: Which residues define the core architecture of the site?
Use Advanced analysis: Key residues to analyse residue occurrence within each cluster.
Interpretation guide:
- Highly frequent residues define the structural scaffold of the binding site.
- Residues enriched in highly druggable pockets may correspond to critical interaction determinants.
Adjusting the residue frequency threshold allows users to move from a strict core definition (high thresholds: ~50% → structural core residues) to a more exploratory, flexible site description (lower thresholds ~25–50% → flexible/adaptive regions). Adjusting frequency thresholds allows exploration of binding-site plasticity at different stringency levels.
Step 5: Prioritise binding sites
Guiding question: Is the site robust enough to prioritise?
Robust binding-site prioritisation relies on converging evidence across multiple criteria:
- sufficient occurrence frequency across the ensemble,
- strong residue-level coherence,
- limited intra-cluster structural variability,
- and consistently high druggability.
Key message: PockFlex prioritisation is not binary; it supports evidence-weighted decision making rather than strict inclusion/exclusion rules.
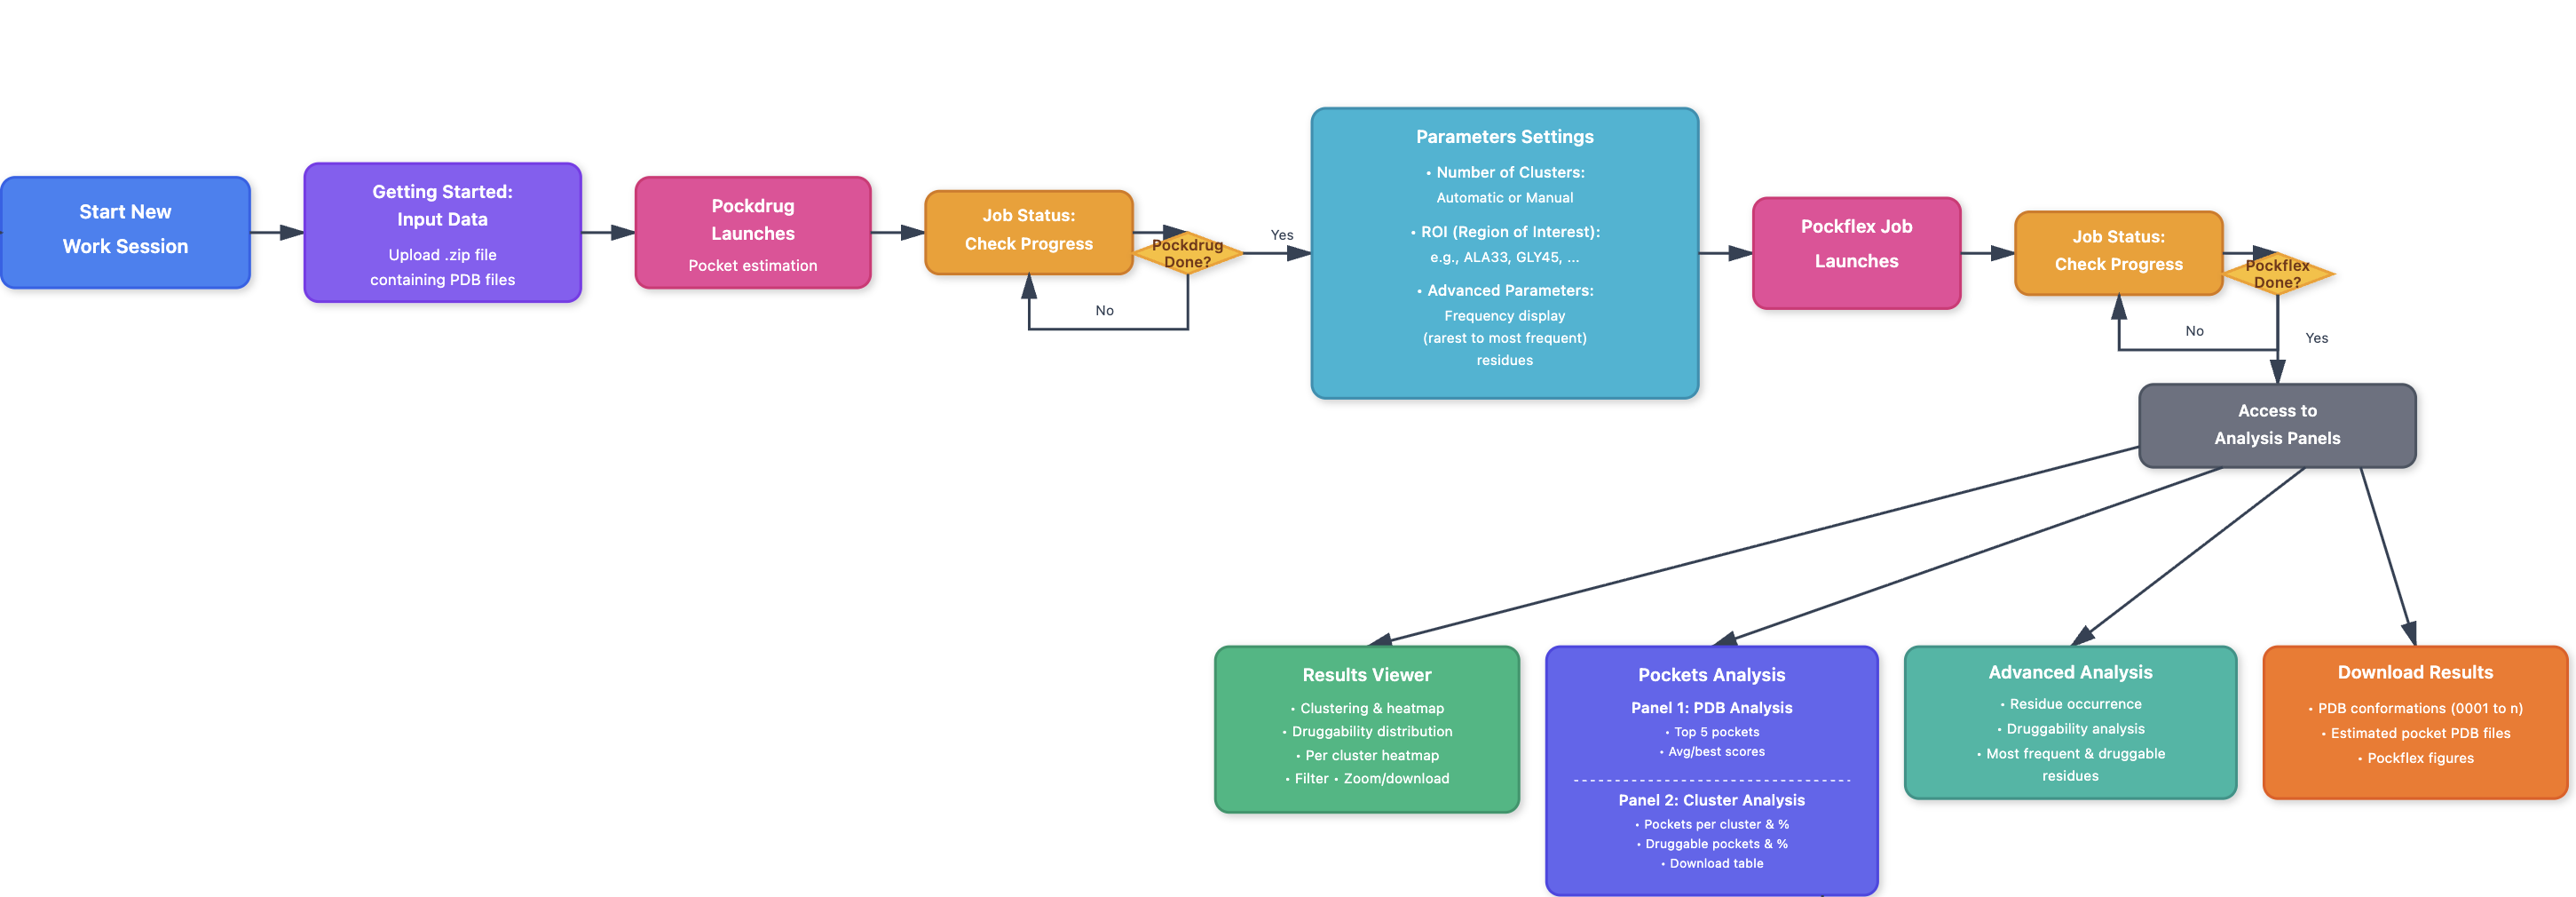
Work sessions & example
The work session's panels help the user to identify rare or recurrent, stable or flexible, and highly druggable binding sites, and to pinpoint key residues shaping both the structural scaffold and the druggability profile of each site. Here we provide a detailed step by step workflow of how to navigate and analyse an example.
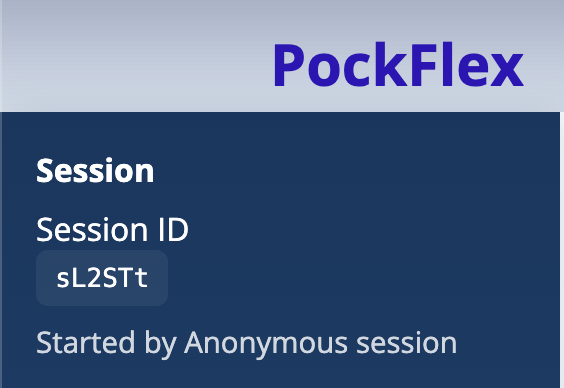
A work session is a temporary, anonymous workspace created to allow users to run and analyse studies on the server. When a session starts, the system automatically generates a confidential identification number (ID) that uniquely corresponds to a single anonymous session. Users may choose to save this ID in order to retrieve their session later, or not save it, in which case the session remains anonymous and temporary.
Using the session ID, users can return to their work session to view, compare, download, run, or re-run multiple studies with different clustering parameters. To ensure data privacy and efficient resource management, each anonymous work session is automatically closed and deleted after 72 hours.
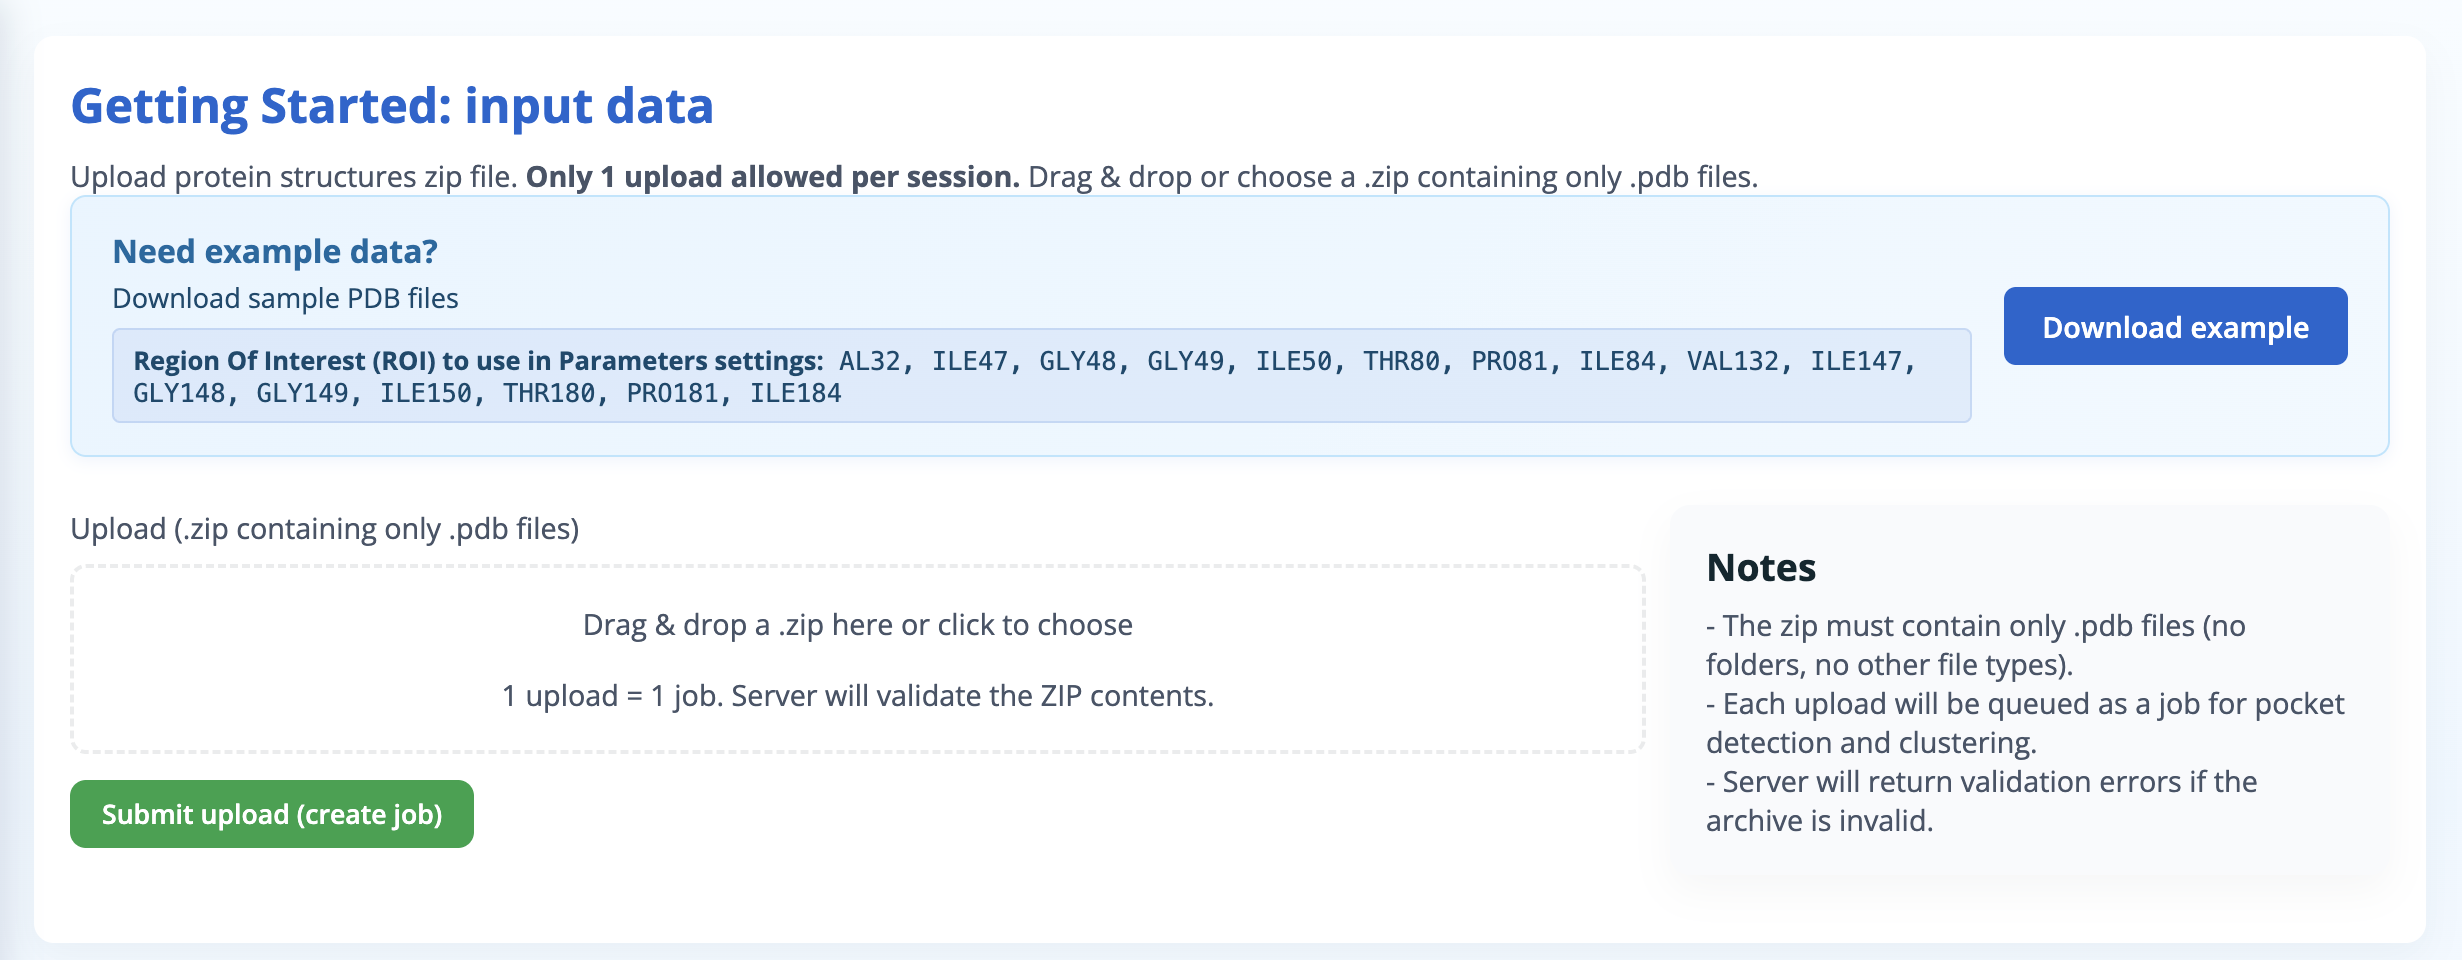
Within a work session, users can upload their data in the Getting started: Input data panel and submit their upload (create job) like shown in Figure 2. If the user needs example data to start, a download zip archive containing pdb files used in this help page is available to upload as a job.
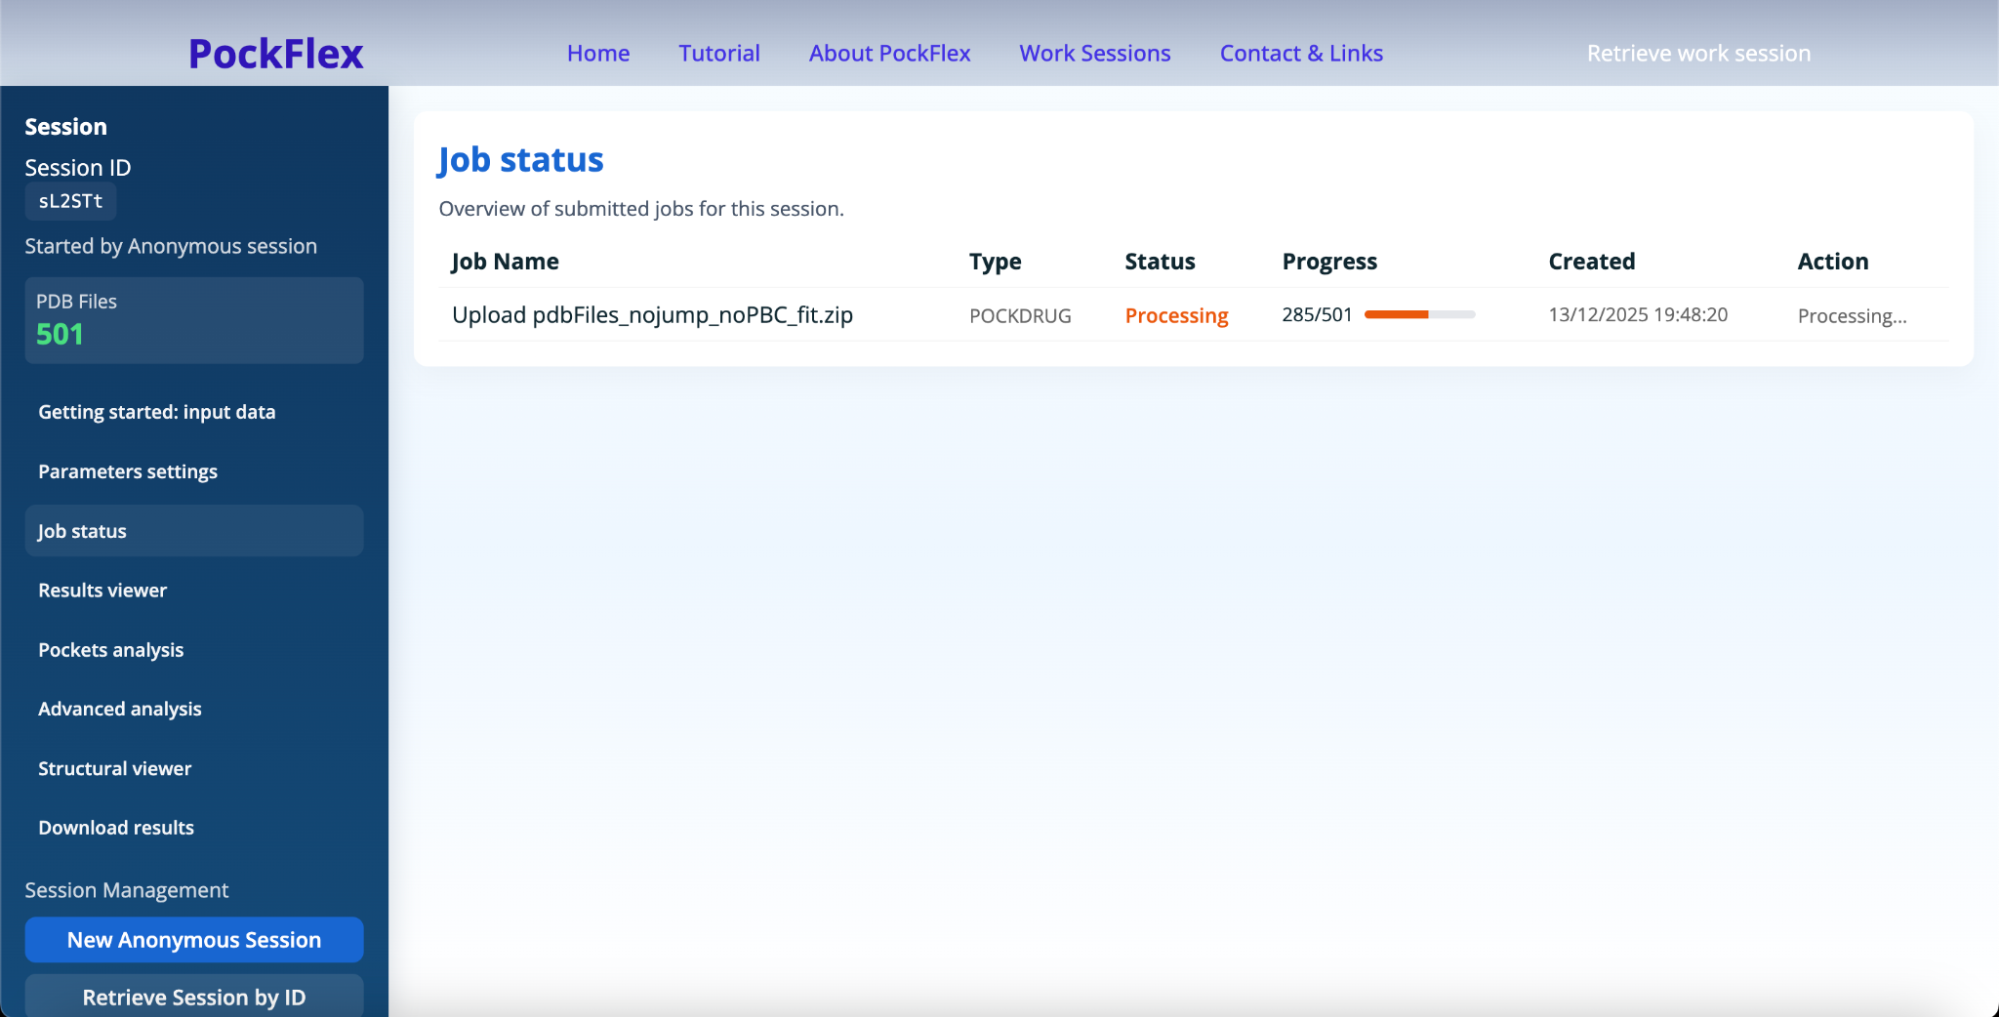
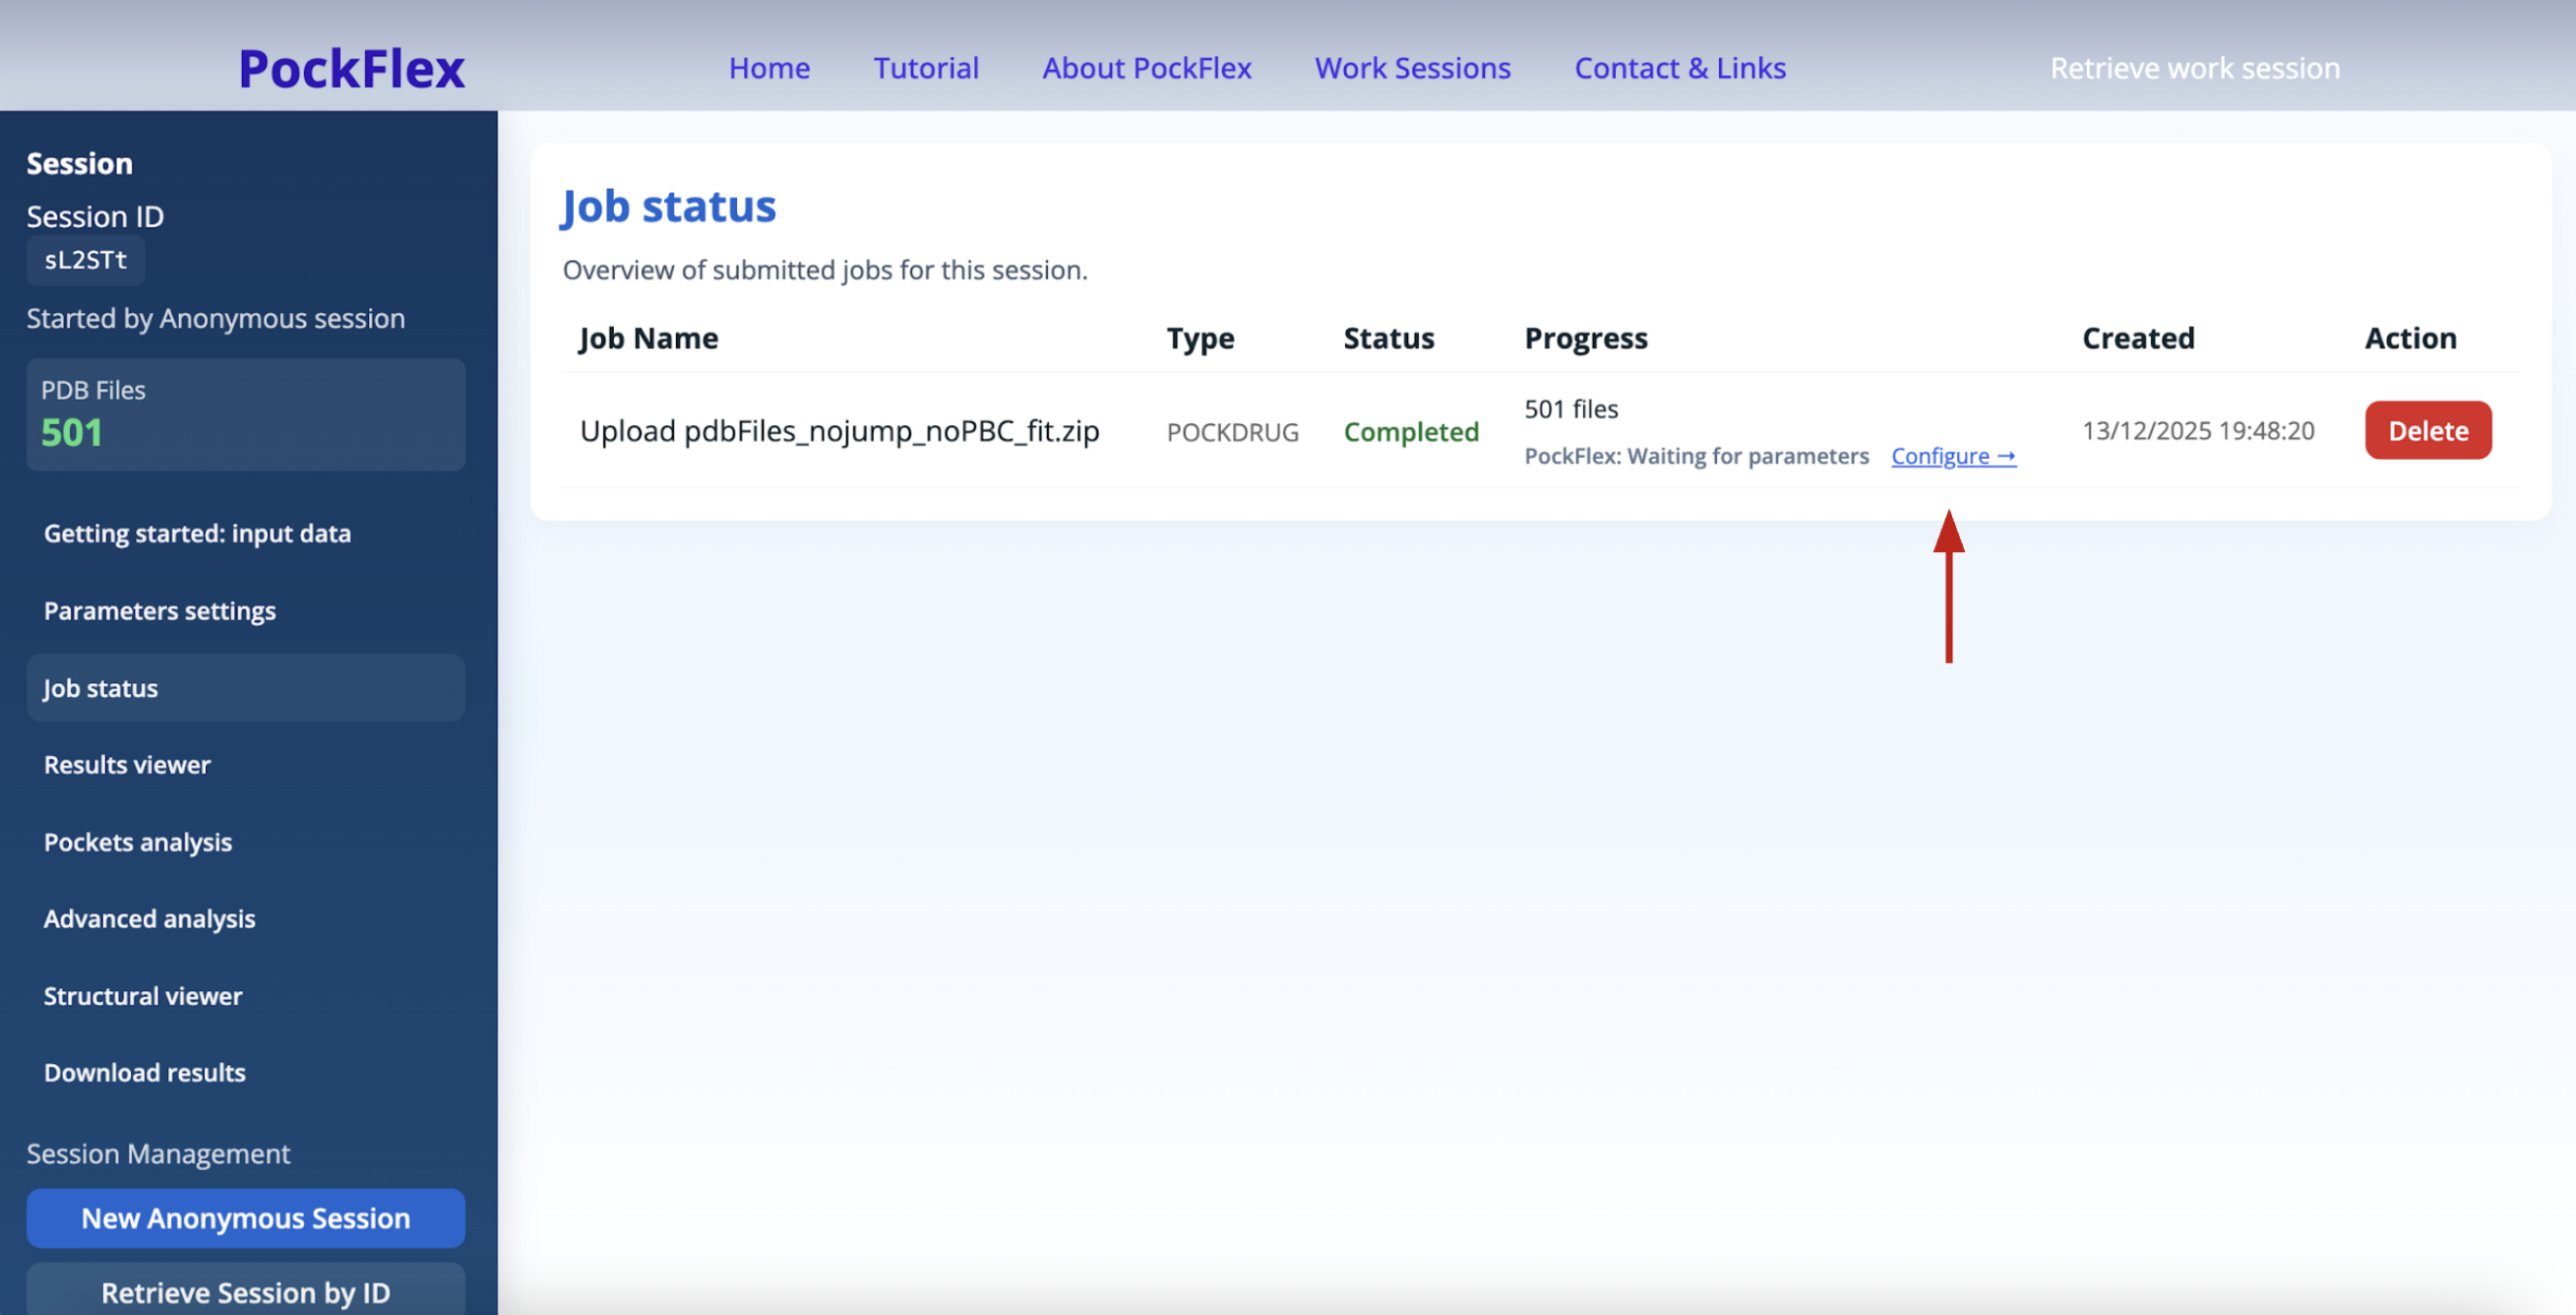
The panel Job status helps to check whether the PockDrug is processing the upload and when the PockFlex job is waiting for parameters (to be configured like shown below), running, completed, or failed.
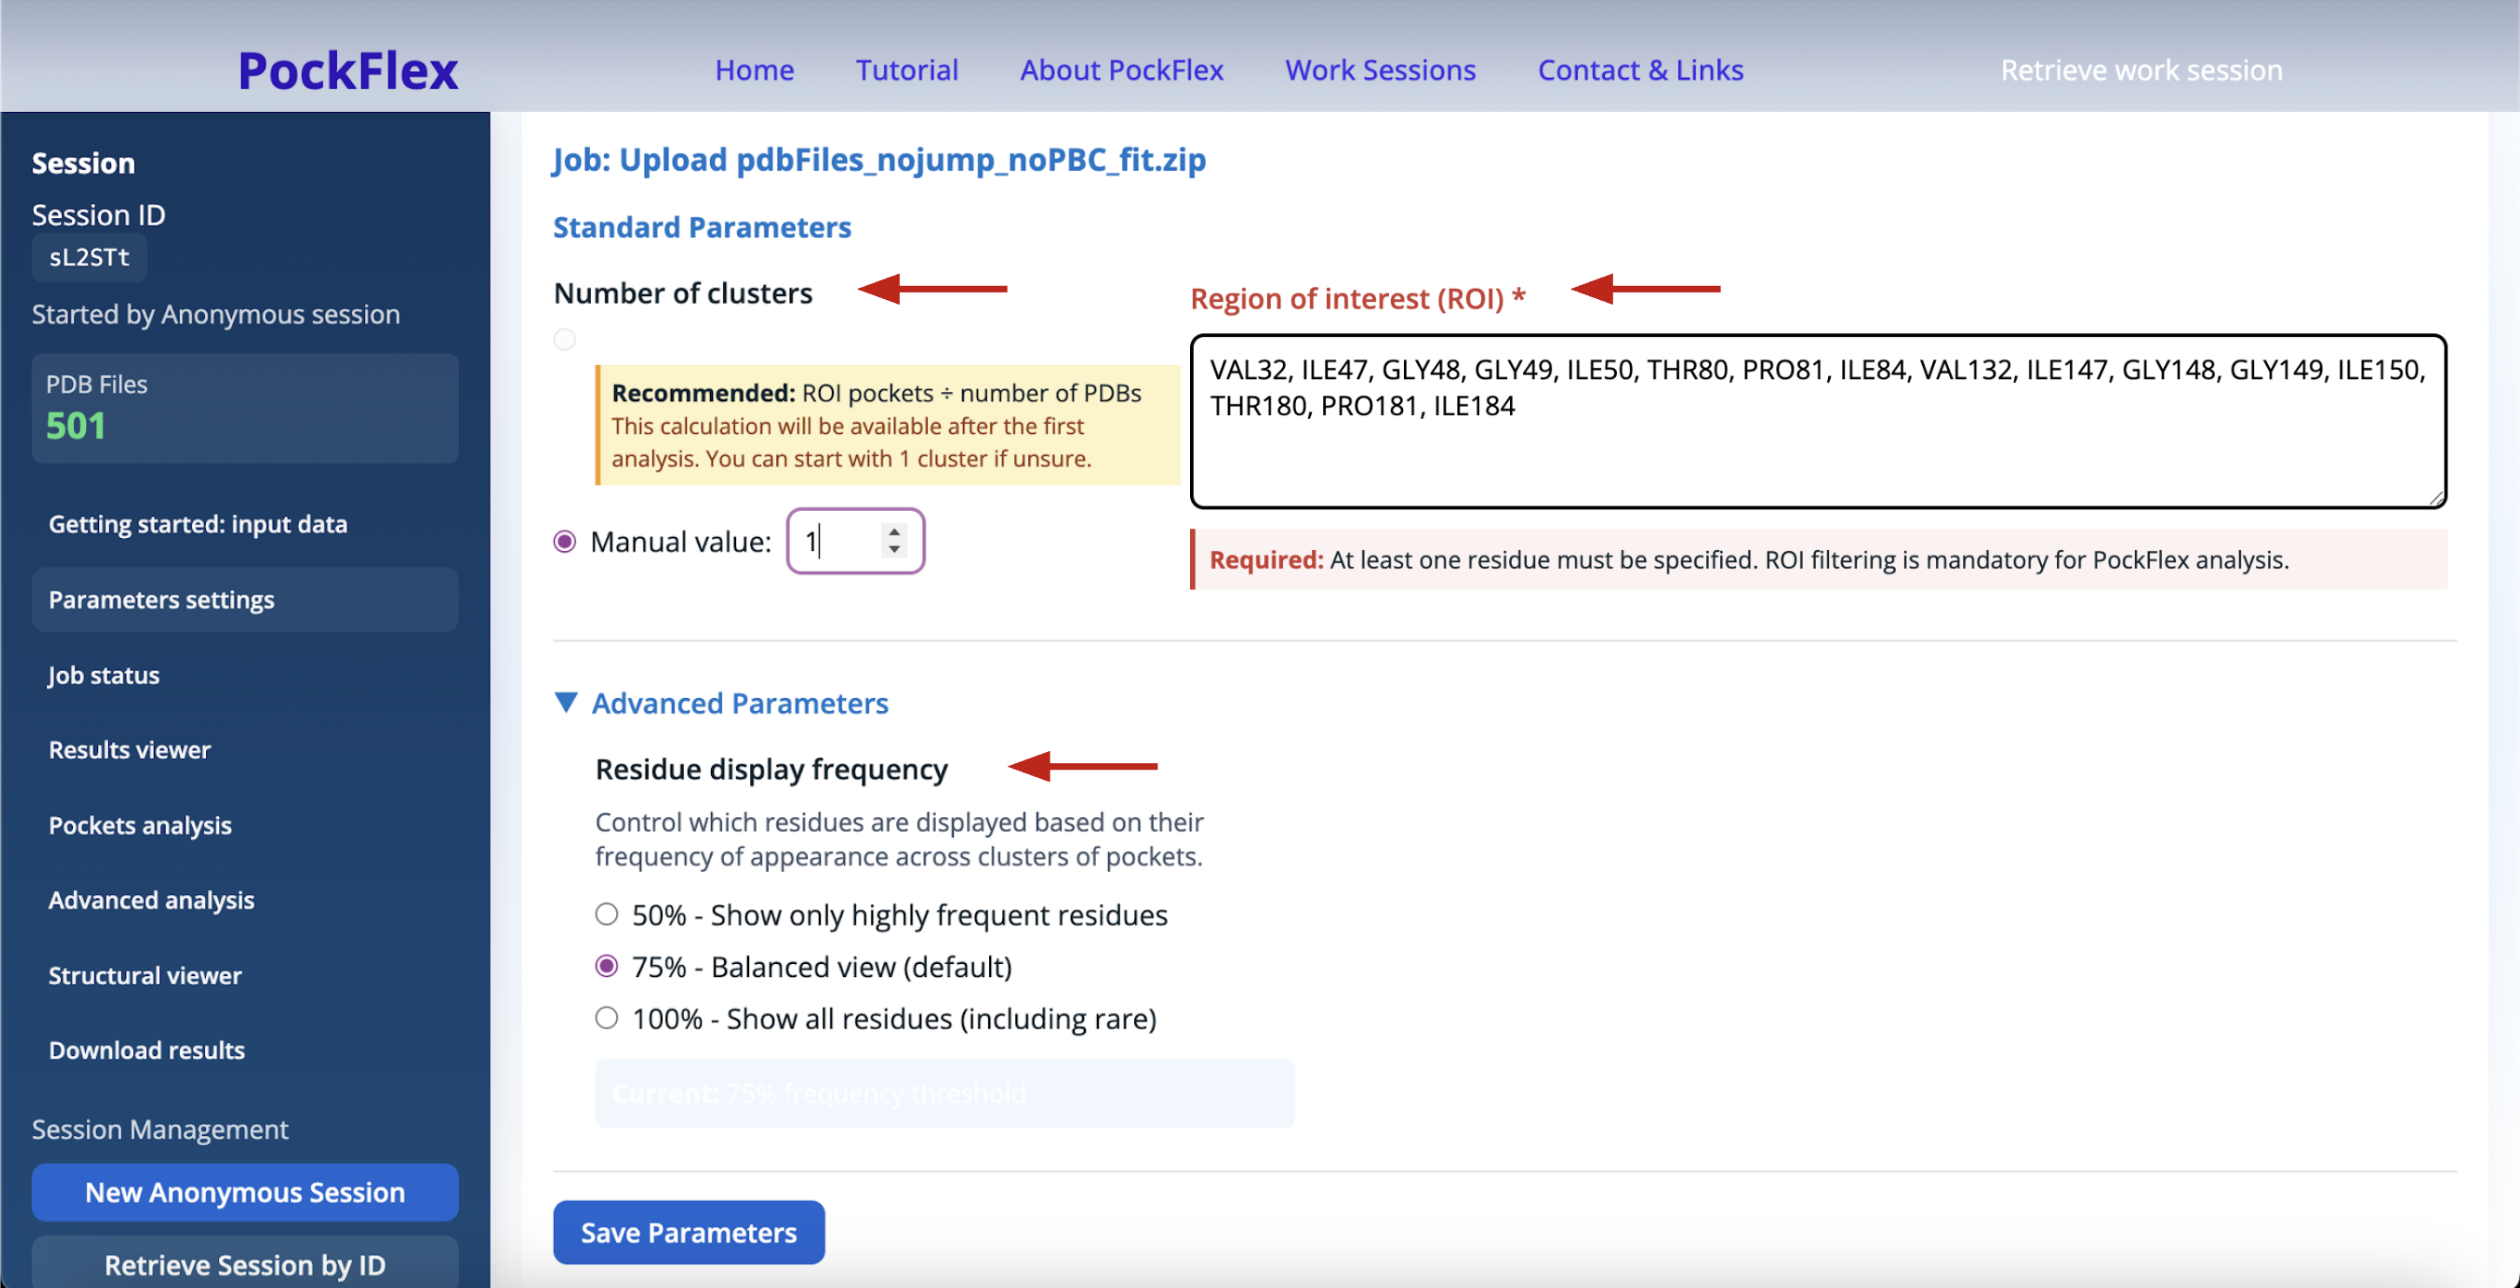
The Parameters settings panel helps refine clustering using standard parameters: the number of clusters, the region of interest (ROI), and additional advanced parameters: the residue display frequency.
Once a PockFlex job is completed, the corresponding results become accessible in the Results viewer panel, where they can be viewed, filtered, and downloaded. The Pockets analysis, the Advanced analysis and the Structural viewer panels also provide information related to the last completed PockFlex job such as an overview of PDB pocket analysis, Cluster pocket analysis, Key residue analysis, and 3D Structural viewer of pockets and conformations. Finally the Download results panel provides downloadable zip archives of PockDrug estimated pockets PDB files with their corresponding conformations PDB files, and PockFlex results figures.
Getting started: Input Data
The PockFlex server accepts structural ensembles in the form of:
- molecular dynamics trajectories converted into sets of PDB snapshots,
- multiple experimental PDB structures,
- reliable alternative PDB files models generated by AlphaFold or SWISS-MODEL.
- ensembles generated from normal mode analysis or coarse-grained simulations, provided that the conformations are available as atomistic PDB files.
All input structures must share a consistent residue numbering scheme to enable accurate pocket comparison and binding-site assembly.
Zip archive file requirements:
- The archive (.zip, .tar.gz, .tgz) must contain only structure files: .pdb, .cif, .pdb.gz, or .cif.gz (no folders, no other file types).
- One upload per session is allowed.
- The server will return validation errors if the archive is invalid.
Job status
Status definitions:
After a user submits an upload, PockFlex launches the pocket estimation using Pockdrug: this job corresponds in the Job Status panel to the 'progressing' state. This means the user's upload is valid and the pipeline started. After this first step, the workflow is 'completed' and the Job status panel shows the user 'PockFlex waiting for parameters' status. Which indicates the user needs to complete the Parameters settings in the dedicated panel. After completion, PockFlex is 'running', then either 'completed' or 'failed'.
Computation time:
To optimise processing time, jobs are parallelised, allowing multiple analyses to run simultaneously. This parallel execution significantly reduces overall computation time and improves the responsiveness of the server for users. Each user can check for the progression state in the Job status panel, an estimation of the computation time is also computed as a prediction after a few PDB files have already been processed in the Getting started: input data panel.
Parameters Settings
Standard Parameters:
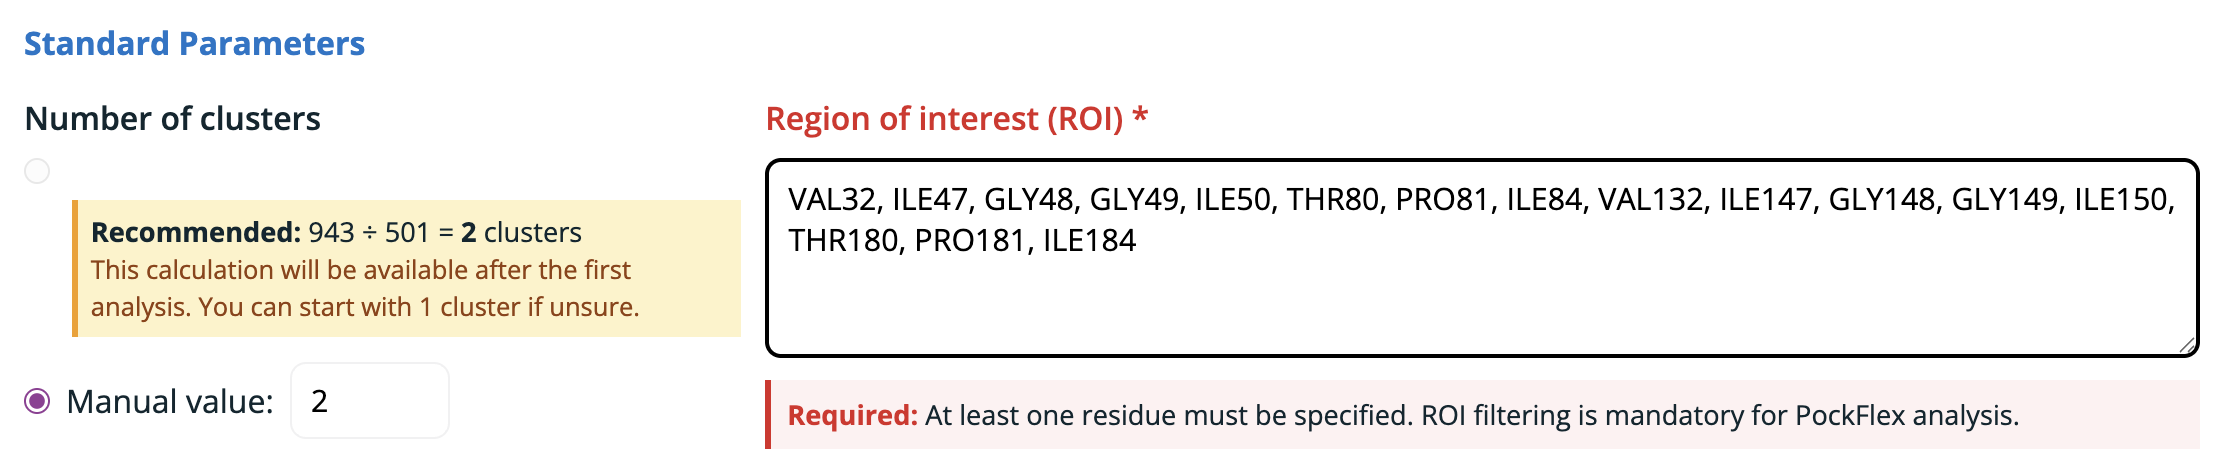
Number of clusters: Rather than relying on a fixed number of clusters, PockFlex provides the choice to the user as well as a data-driven recommended number of clusters computed after a first analysis. It is defined as the rounded average number of pockets detected within the ROI per conformation across the ensemble, in our example (Figure 6): 784 pockets estimated on the ROI divided by 501 pdb files uploaded. This heuristic provides an intuitive estimate of the expected number of binding sites while adapting to the intrinsic variability of the system.
Region of interest (ROI): PockFlex focuses on pocket detection and clustering on a user-defined region of interest (ROI) to ensure manageable and interpretable results. The ROI corresponds to a selected subset of residues or a spatial neighbourhood of the protein, allowing the analysis to focus on functionally relevant regions such as active sites, interfaces, or allosteric sites. The user defines the region of interest by providing a list of amino acids, for example: ILE47, GLY48, GLY49, ILE50, GLY52, ILE54, VAL56, GLY78, THR80, PRO81, ILE84. Pockets detected within the user-defined region of interest across the structural ensemble are assembled into representative binding sites based on residue similarity.
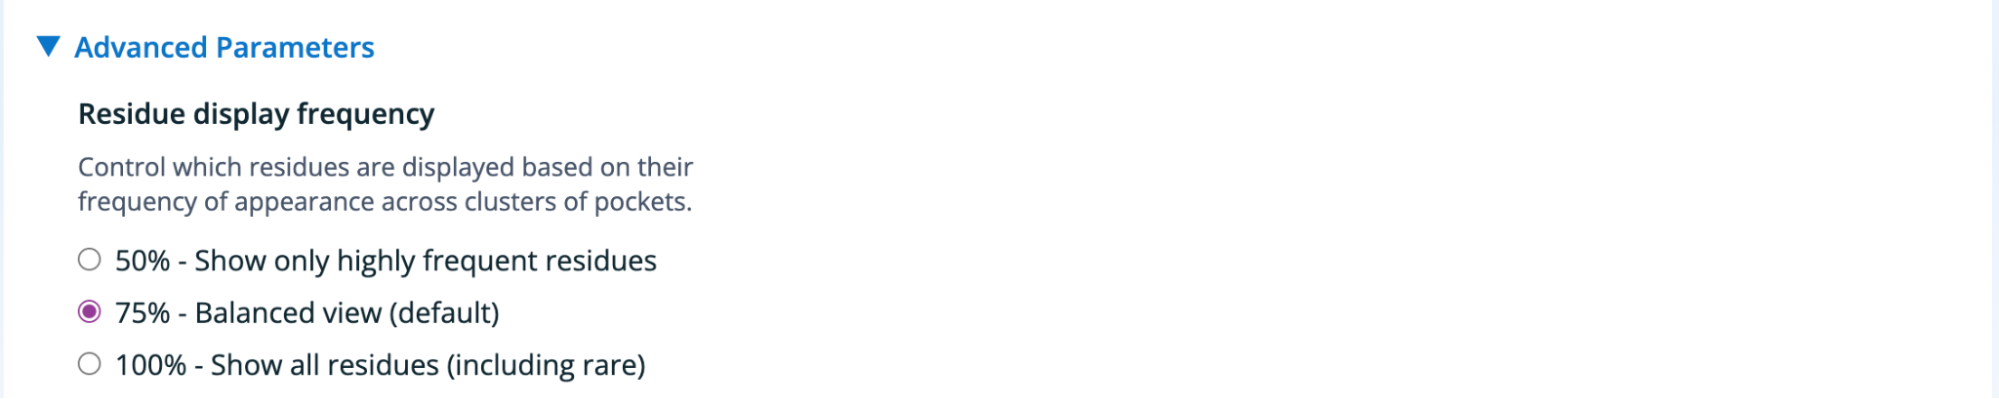
Advanced Parameters:
Residue display frequency: This parameter controls which residues are displayed based on how frequently they appear across pocket clusters (Figure 7). Adjusting this threshold allows the user to focus either on conserved residues or to explore rarer, more transient contributions.
- 50 % : Displays only highly frequent residues shared by a majority of pocket conformations, highlighting stable and conserved features.
- 75 % : Provides a balanced view between conserved and variable residues (default).
- 100 % : Displays all residues, including rare or transient ones, offering a comprehensive view of pocket variability.
Results viewer
In the Results viewer section, all analyses shown in this section are performed on the results associated with the last run job only. Here, we provide a complete description of the panel and its analytical utilities (Figure 8).
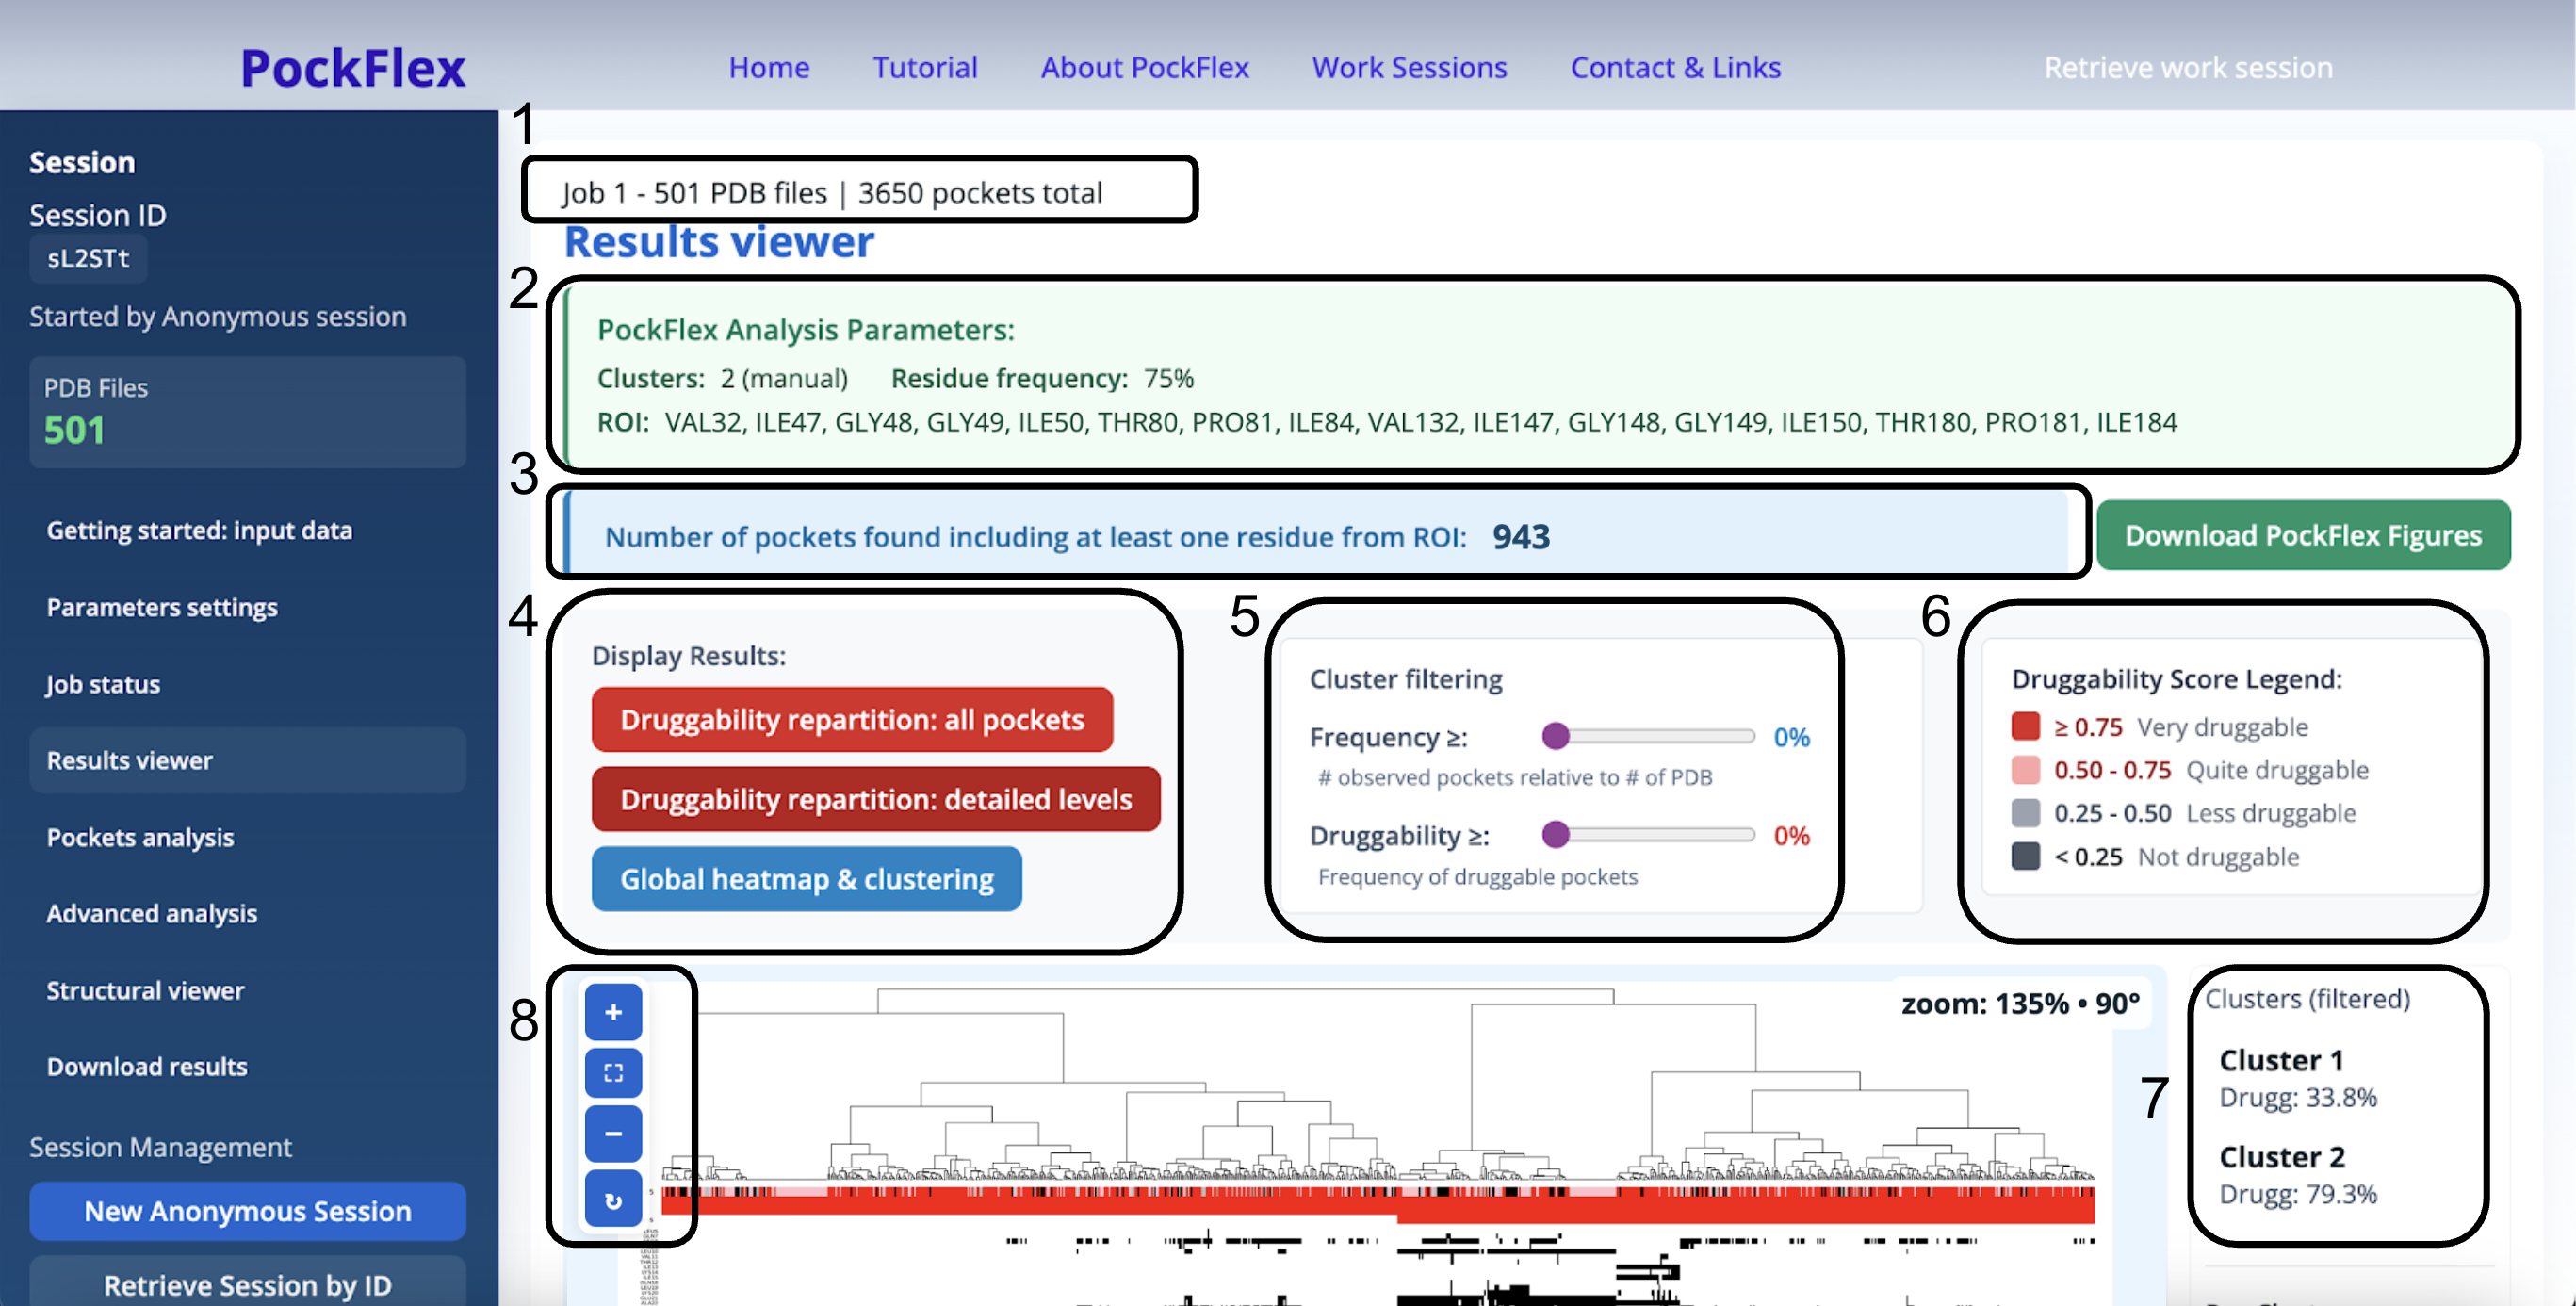
- 1. Shows the total number of pdb files and their total number of estimated pockets
- 2. Provides the PockFlex Analysis Parameters for the current results display
- 3. Computes the number of pockets found including at least one residue from the ROI
- 4. These buttons are all clickable:
- Druggability repartition: all pockets: histogram showing the number of druggable pockets (druggability score ≥ 0.5) and non-druggable pockets (druggability score < 0.5), relative to the total number of pockets identified across the PDB structures.
- Druggability repartition: detailed levels: histogram displaying the distribution of pockets across druggability score ranges, relative to the total number of pockets identified across the PDB structures
- Global heatmap & clustering: hierarchical clustering of predicted pockets on pdb files
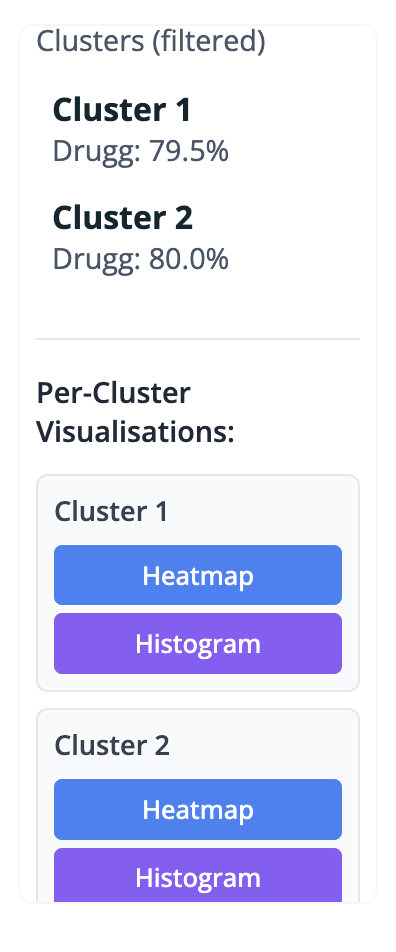
- 5. Cluster Filtering: threshold-based refinement tool allowing filtering of candidate binding sites according to occurrence across the ensemble and/or predicted druggability.
- Frequency: the value selected by the user filters clusters on 7 with an observed pocket frequency equal or greater than the chosen threshold, relative to the number of PDB structures analysed. It reflects how often a given pocket is detected across the structural ensemble, allowing persistent, transient, and rare pockets to be distinguished.
- Druggability: the value selected by the user filters pocket clusters based on their druggability rate, retaining only clusters for which the proportion of druggable pockets equal or greater than the chosen threshold. This reflects the fraction of pockets within a cluster predicted to be druggable and enables the identification of clusters enriched in consistently druggable sites.
- 6. Druggability score legend: the druggability score ranges from 0 to 1 and reflects the predicted ability of a pocket to bind drug-like molecules. Higher scores indicate greater druggability. Pockets with a druggability score ≥ 0.75 are classified as very druggable (red), pockets with a score between equal or greater than 0.5 and less than 0.75 are considered quite druggable (pink), those with a score less than 0.5 and equal or greater than 0.25 are less druggable (light grey), and finally pockets with a score less than 0.25 are not druggable (grey).
- 7. Clusters (filtered): list of clusters filtered using the frequency and druggability thresholds, heatmaps & histograms are displayed (shown and explained in details below)
- 8. Zoom and rotation: mouse wheel or +/- buttons to zoom, click once and drag to move (when zoomed), button to rotate
All figures displayed in the Results Viewer panel can be downloaded either via the Download PockFlex figures button or through the Download Results panel. The figures described below are taken from the ZIP archive generated by PockFlex and are identical to those displayed in the web interface.
Druggability repartition: all pockets
This histogram summarises the overall druggability of the identified pockets by showing the number of druggable pockets in red (druggability score ≥ 0.5) and non-druggable pockets in grey (druggability score < 0.5), relative to the total number of pockets detected across the analysed PDB structures.
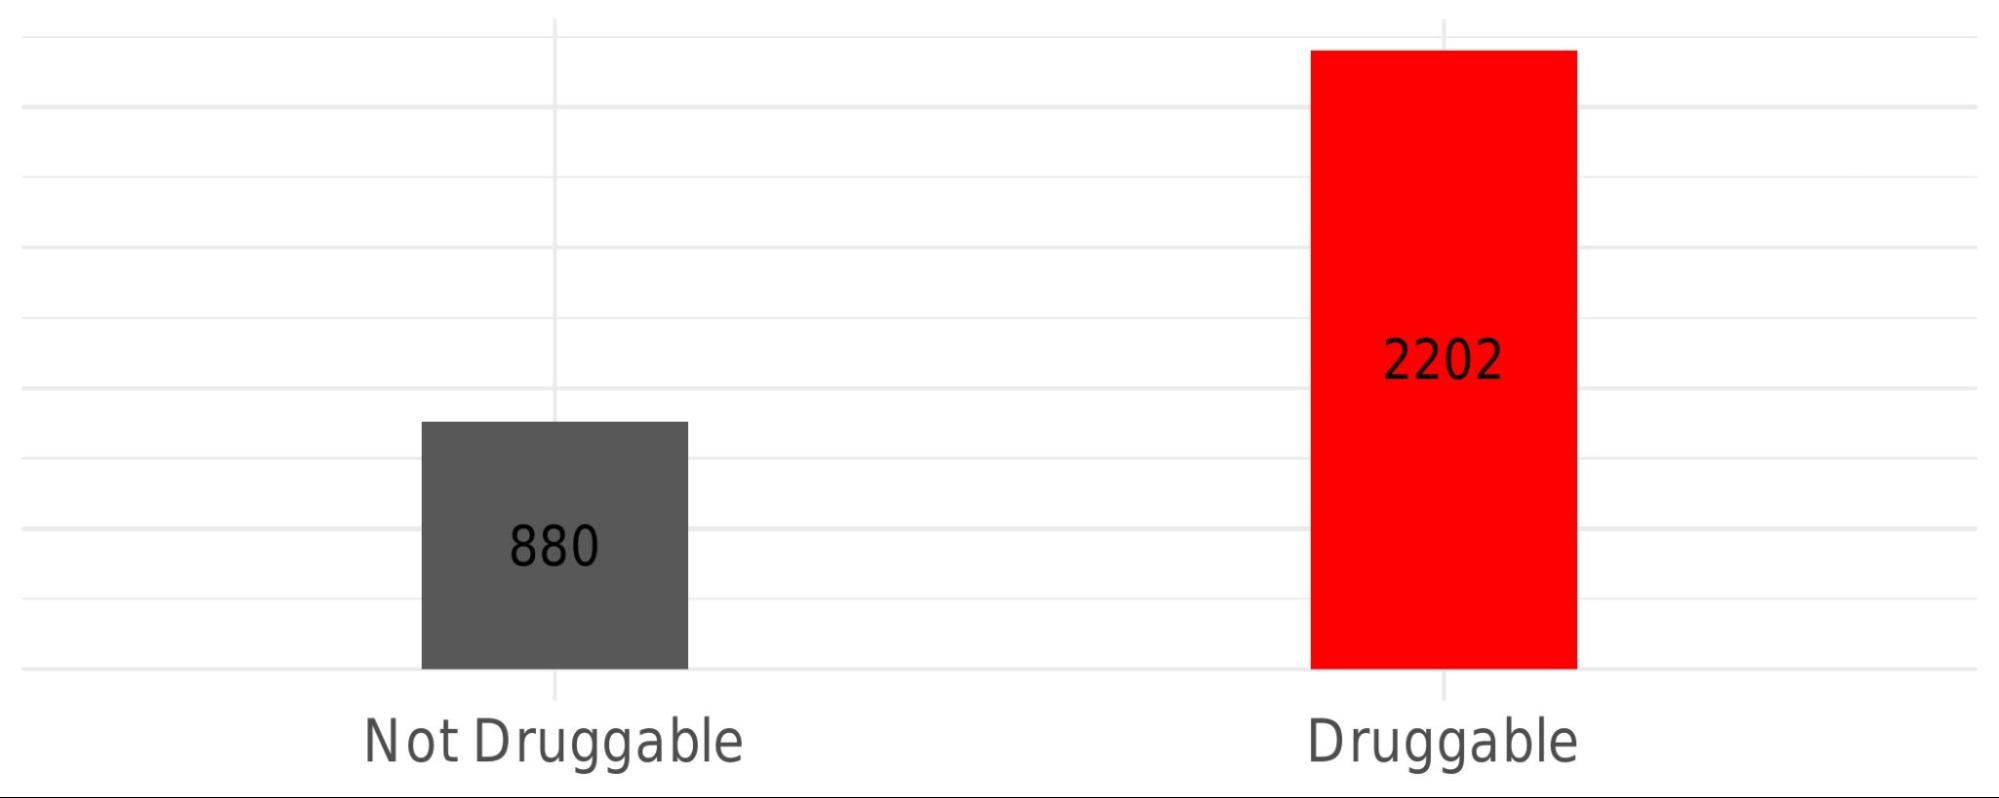
Note: Not all pockets estimated are considered, we do not keep the pockets with residues less than 8.
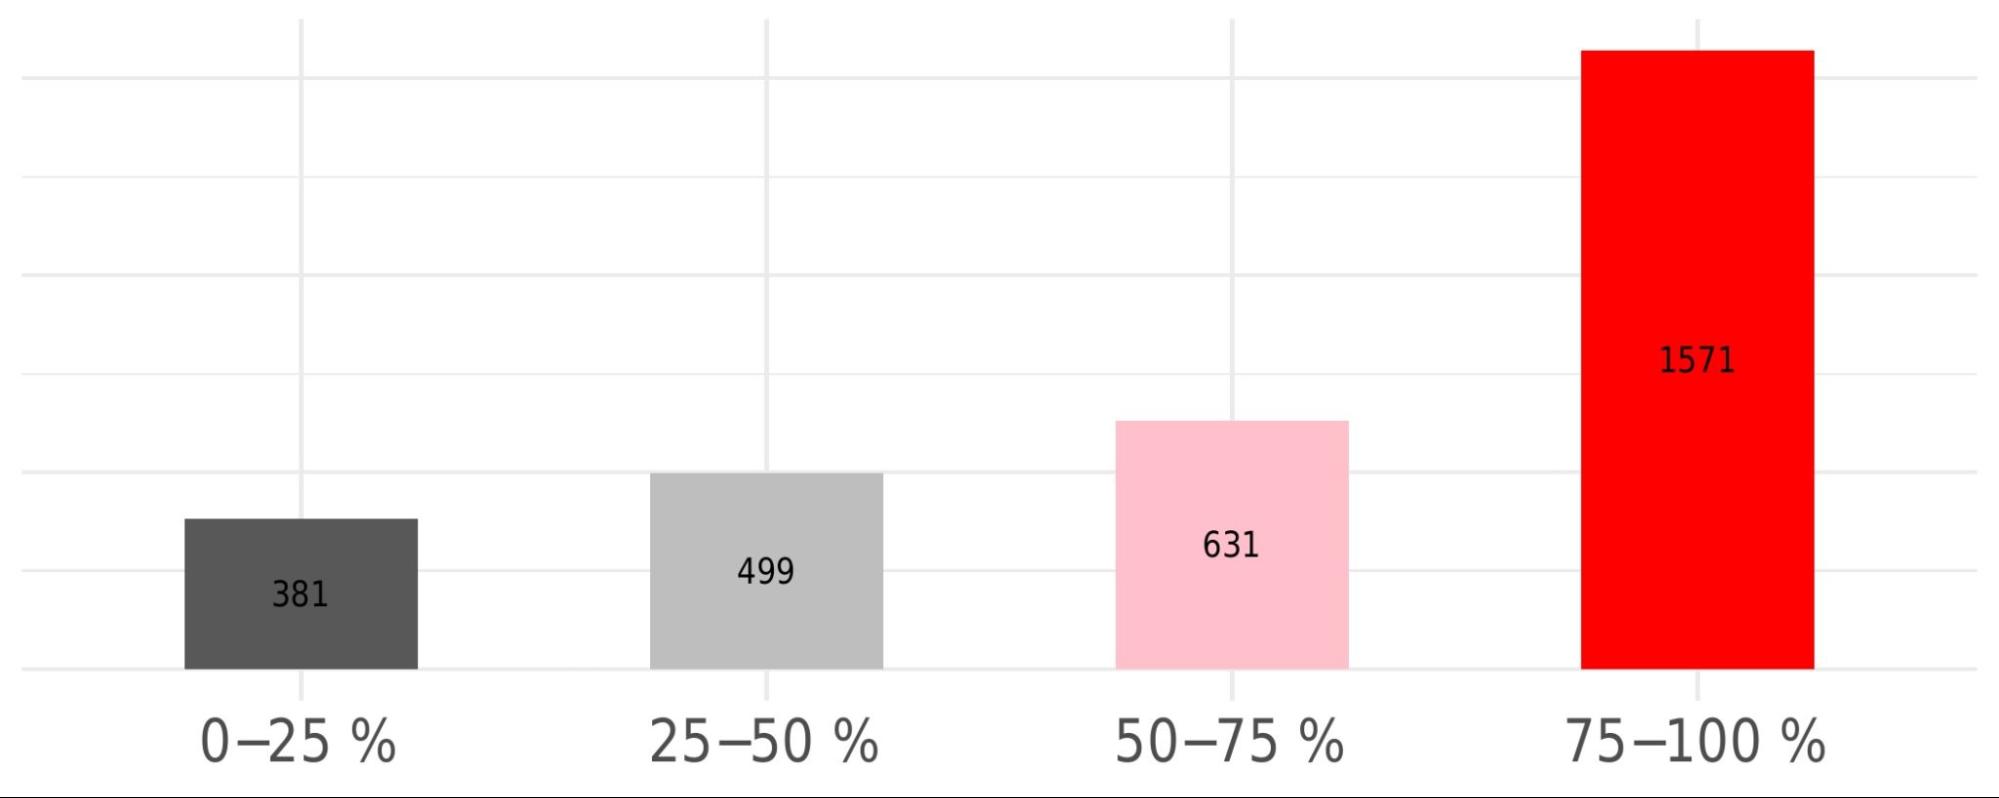
Druggability distribution: detailed levels
This histogram provides a finer-grained view of pocket druggability by displaying the distribution of pockets across defined druggability score ranges, relative to the total number of pockets detected across the analysed PDB structures.
Global heatmap and clustering representation:
The clustering is displayed as a combined dendrogram and heatmap. The dendrogram represents the hierarchical clustering of pockets based on residue similarity.
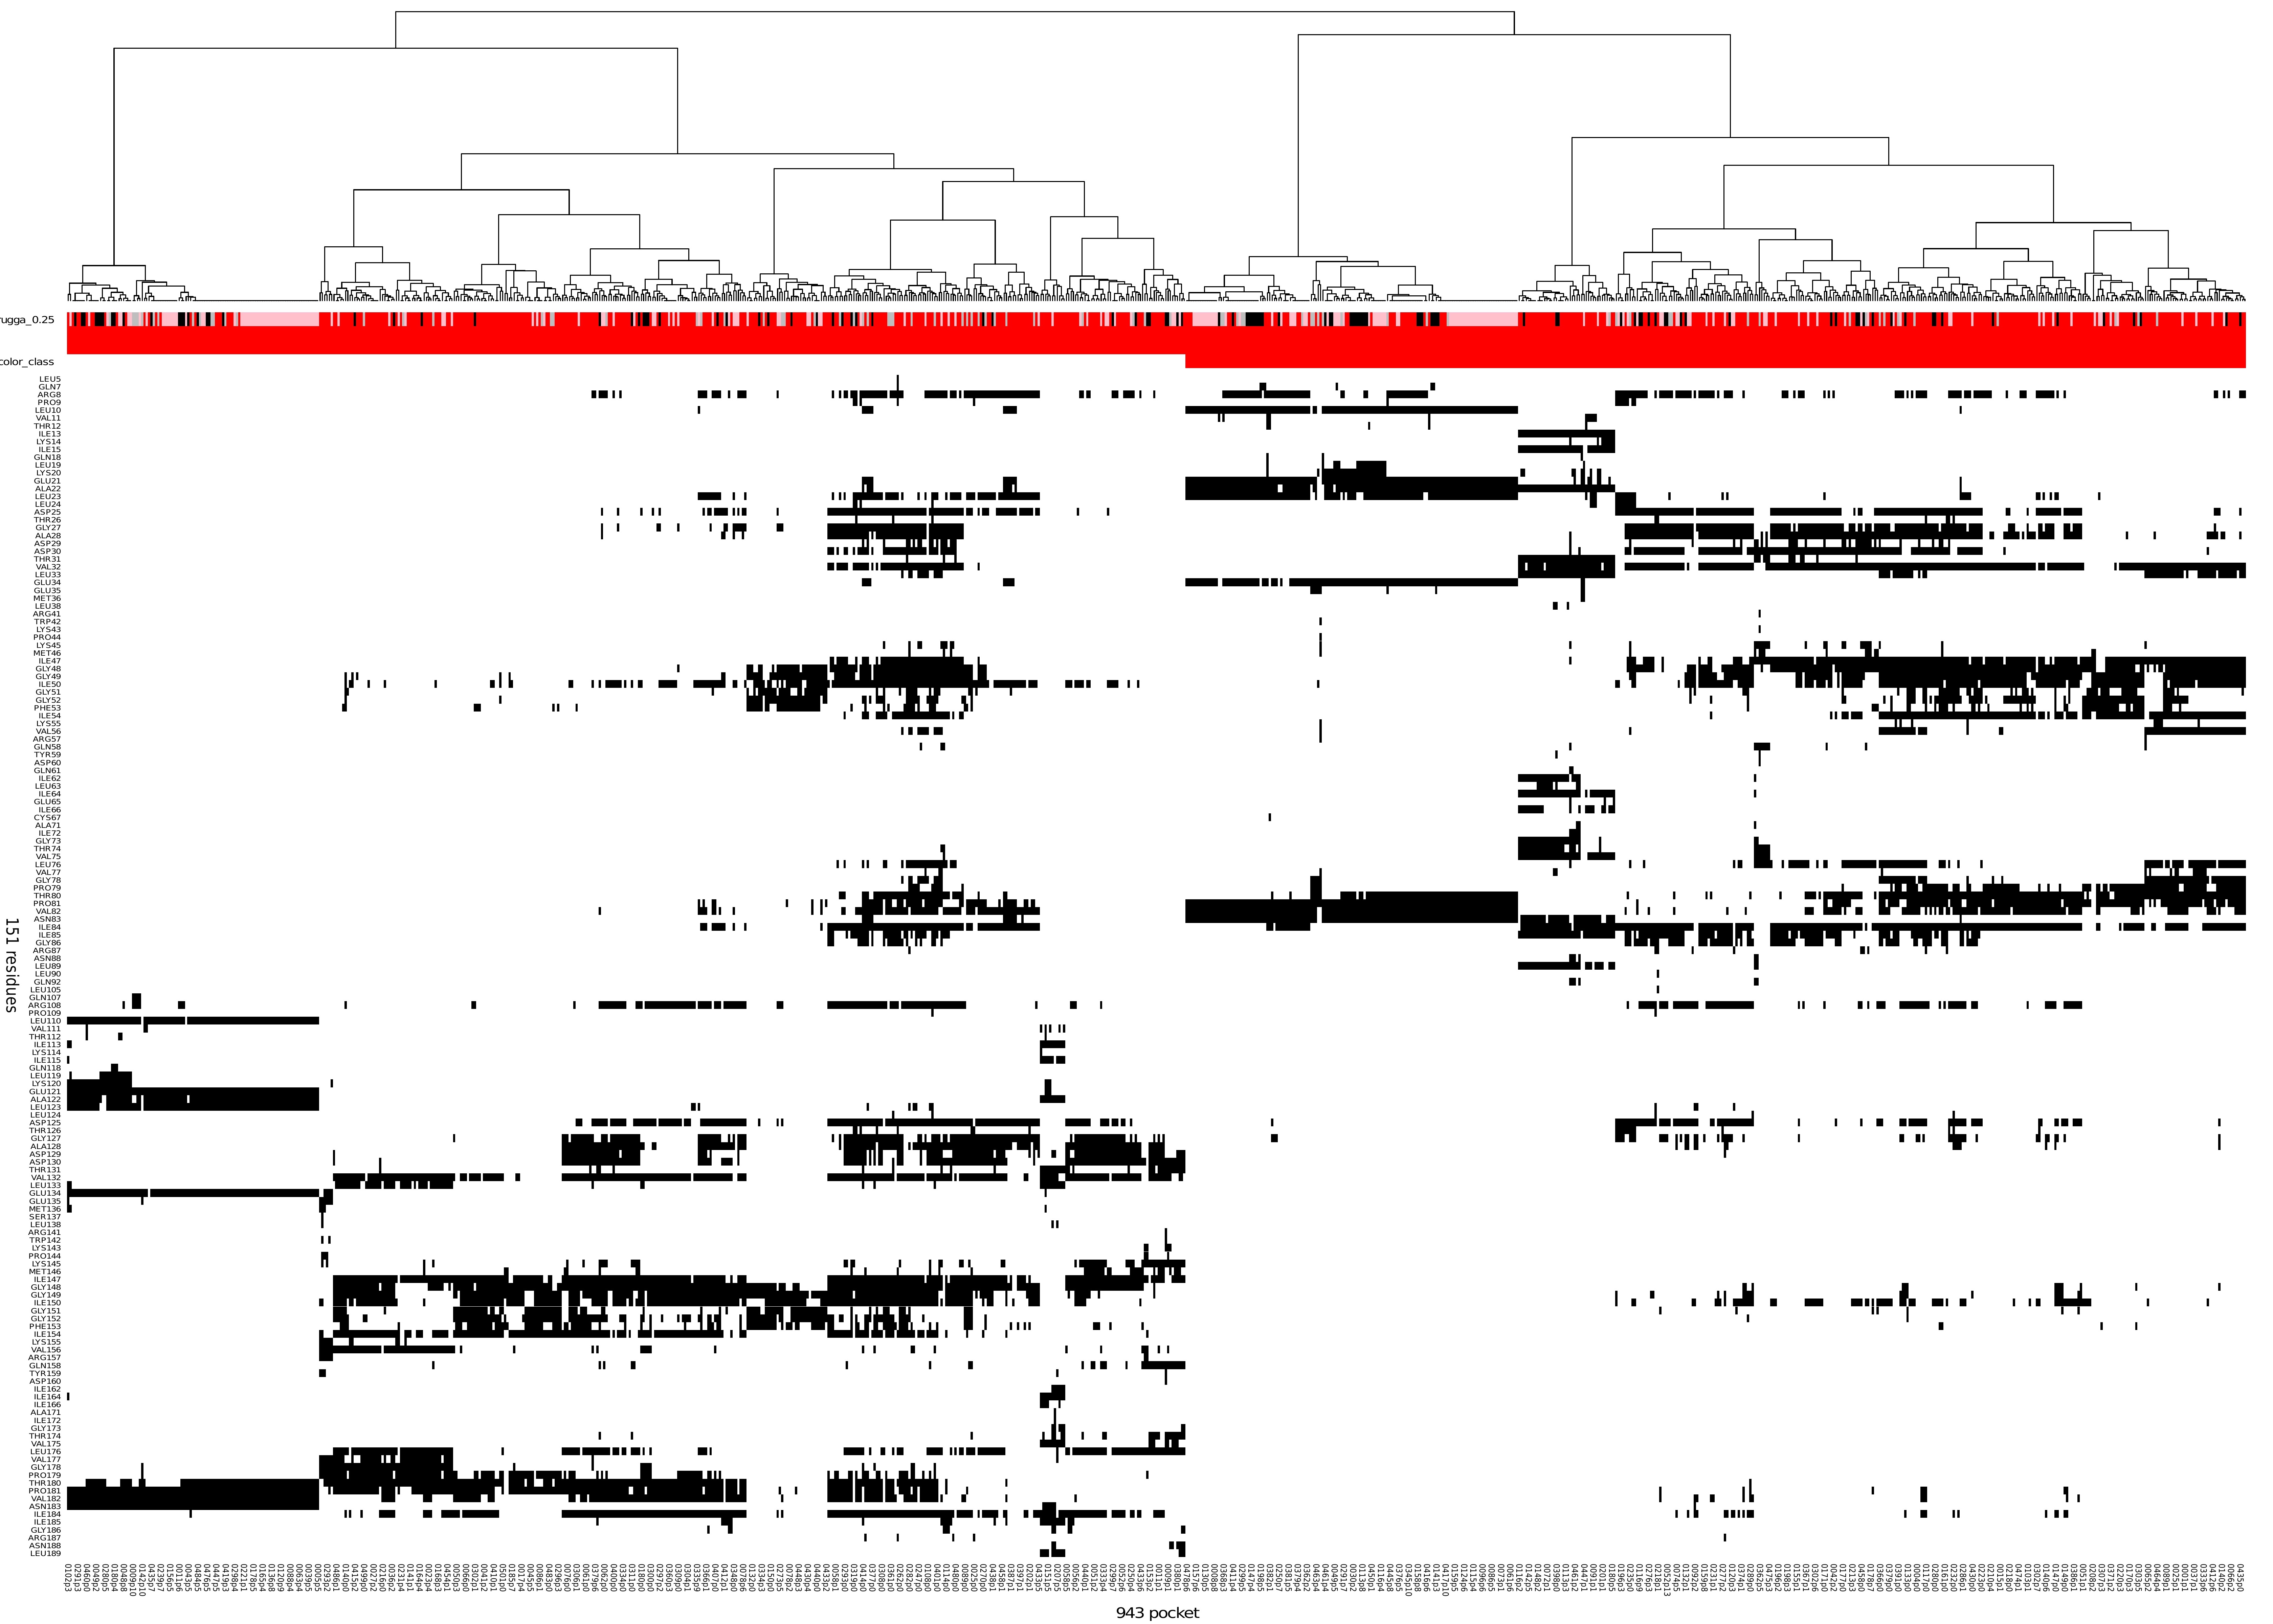
The heatmap (figure 12) shows pocket–residue associations, where the x-axis corresponds to individual pockets labelled by conformation and pocket index (e.g. 0001p1, indicating pocket 1 in conformation 0001), and the y-axis corresponds to residues. A black cell in the heatmap indicates the occurrence of the residue listed on the y-axis within the corresponding pocket on the x-axis.
Above the heatmap, and directly below the dendrogram, an additional annotation bar displays the druggability score associated with each pocket, encoded according to the druggability colour legend described in section 6 from the Results viewer panel (Figure 8). Below this axis, an additional annotation indicates cluster class assignment; in this representation example, two classes are displayed and encoded in white and red.
Taken together, the dendrogram (top), heatmap (centre), druggability and class annotations provide an integrated view of pocket similarity, residue composition, and druggability across the ensemble.
Clusters (filtered):
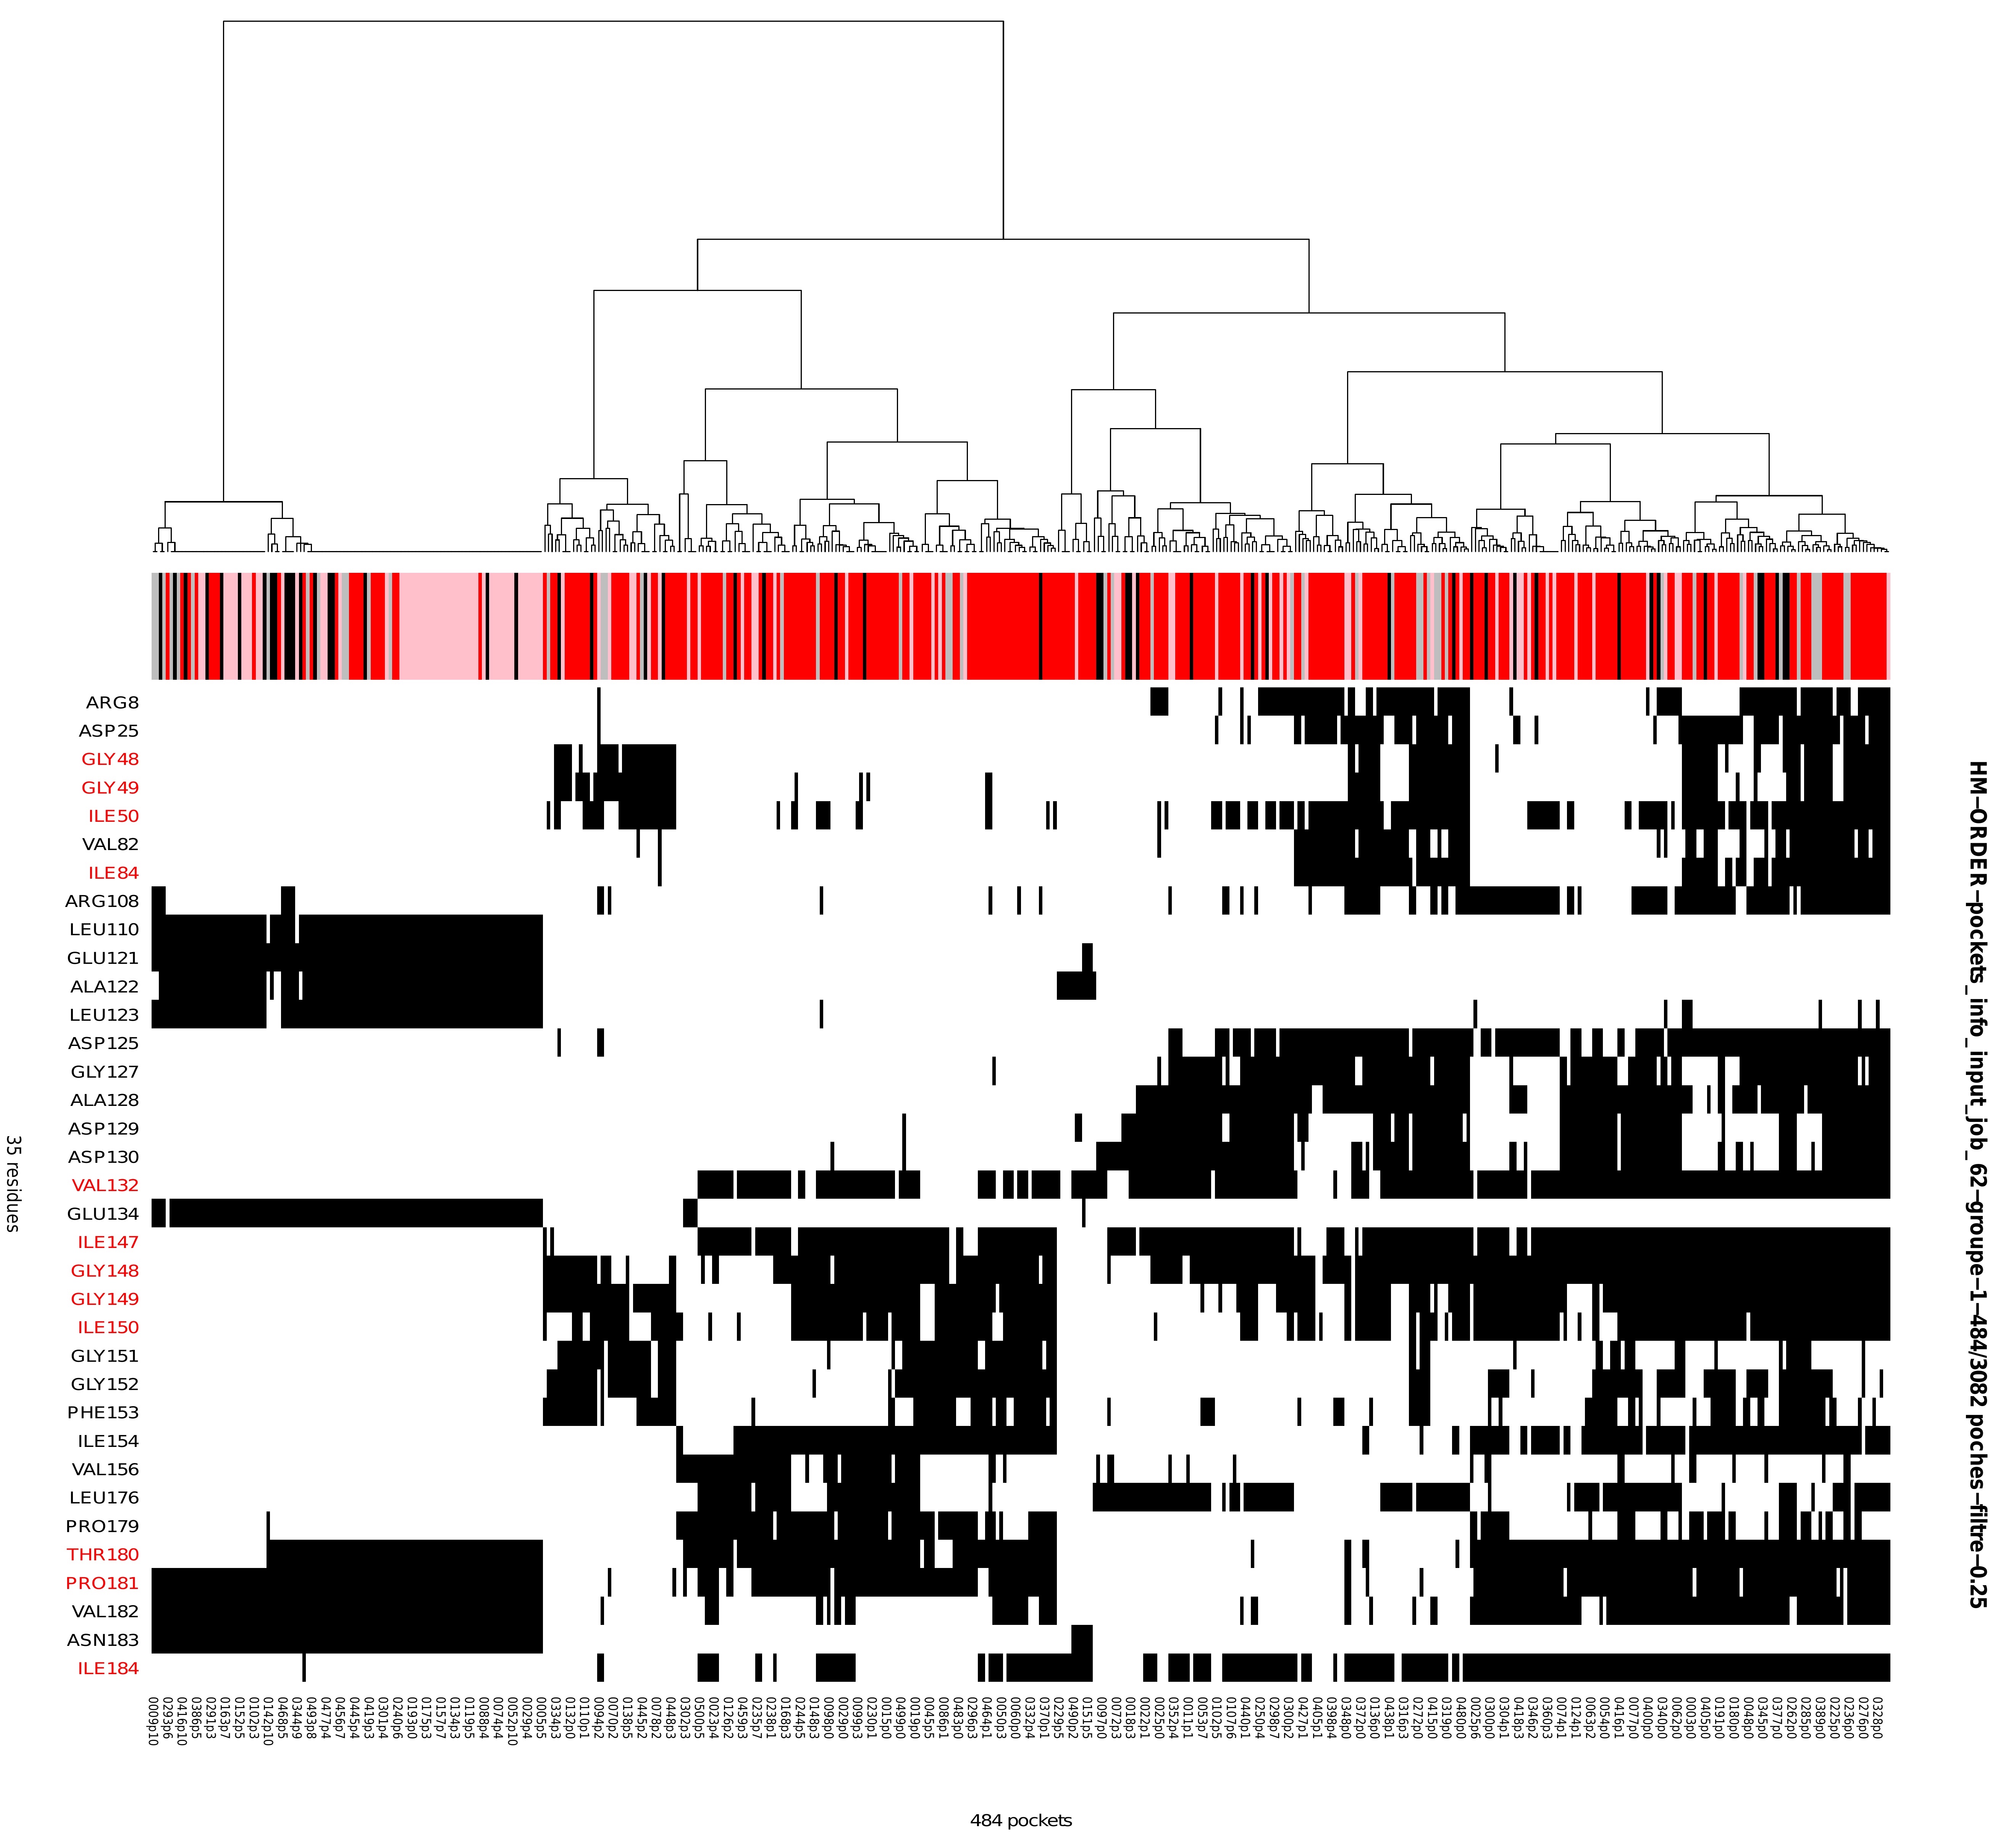
Cluster characterisation: for each cluster from the global clustering, residue composition and druggability properties are jointly characterised using complementary visualisations, combining residue-level frequency histograms and hierarchical clustering heatmaps. As explained above, this section displays more or fewer clusters depending on the selected thresholds. With frequency and druggability thresholds set to 0%, all cluster heatmaps and histograms are shown, as illustrated in the example below.
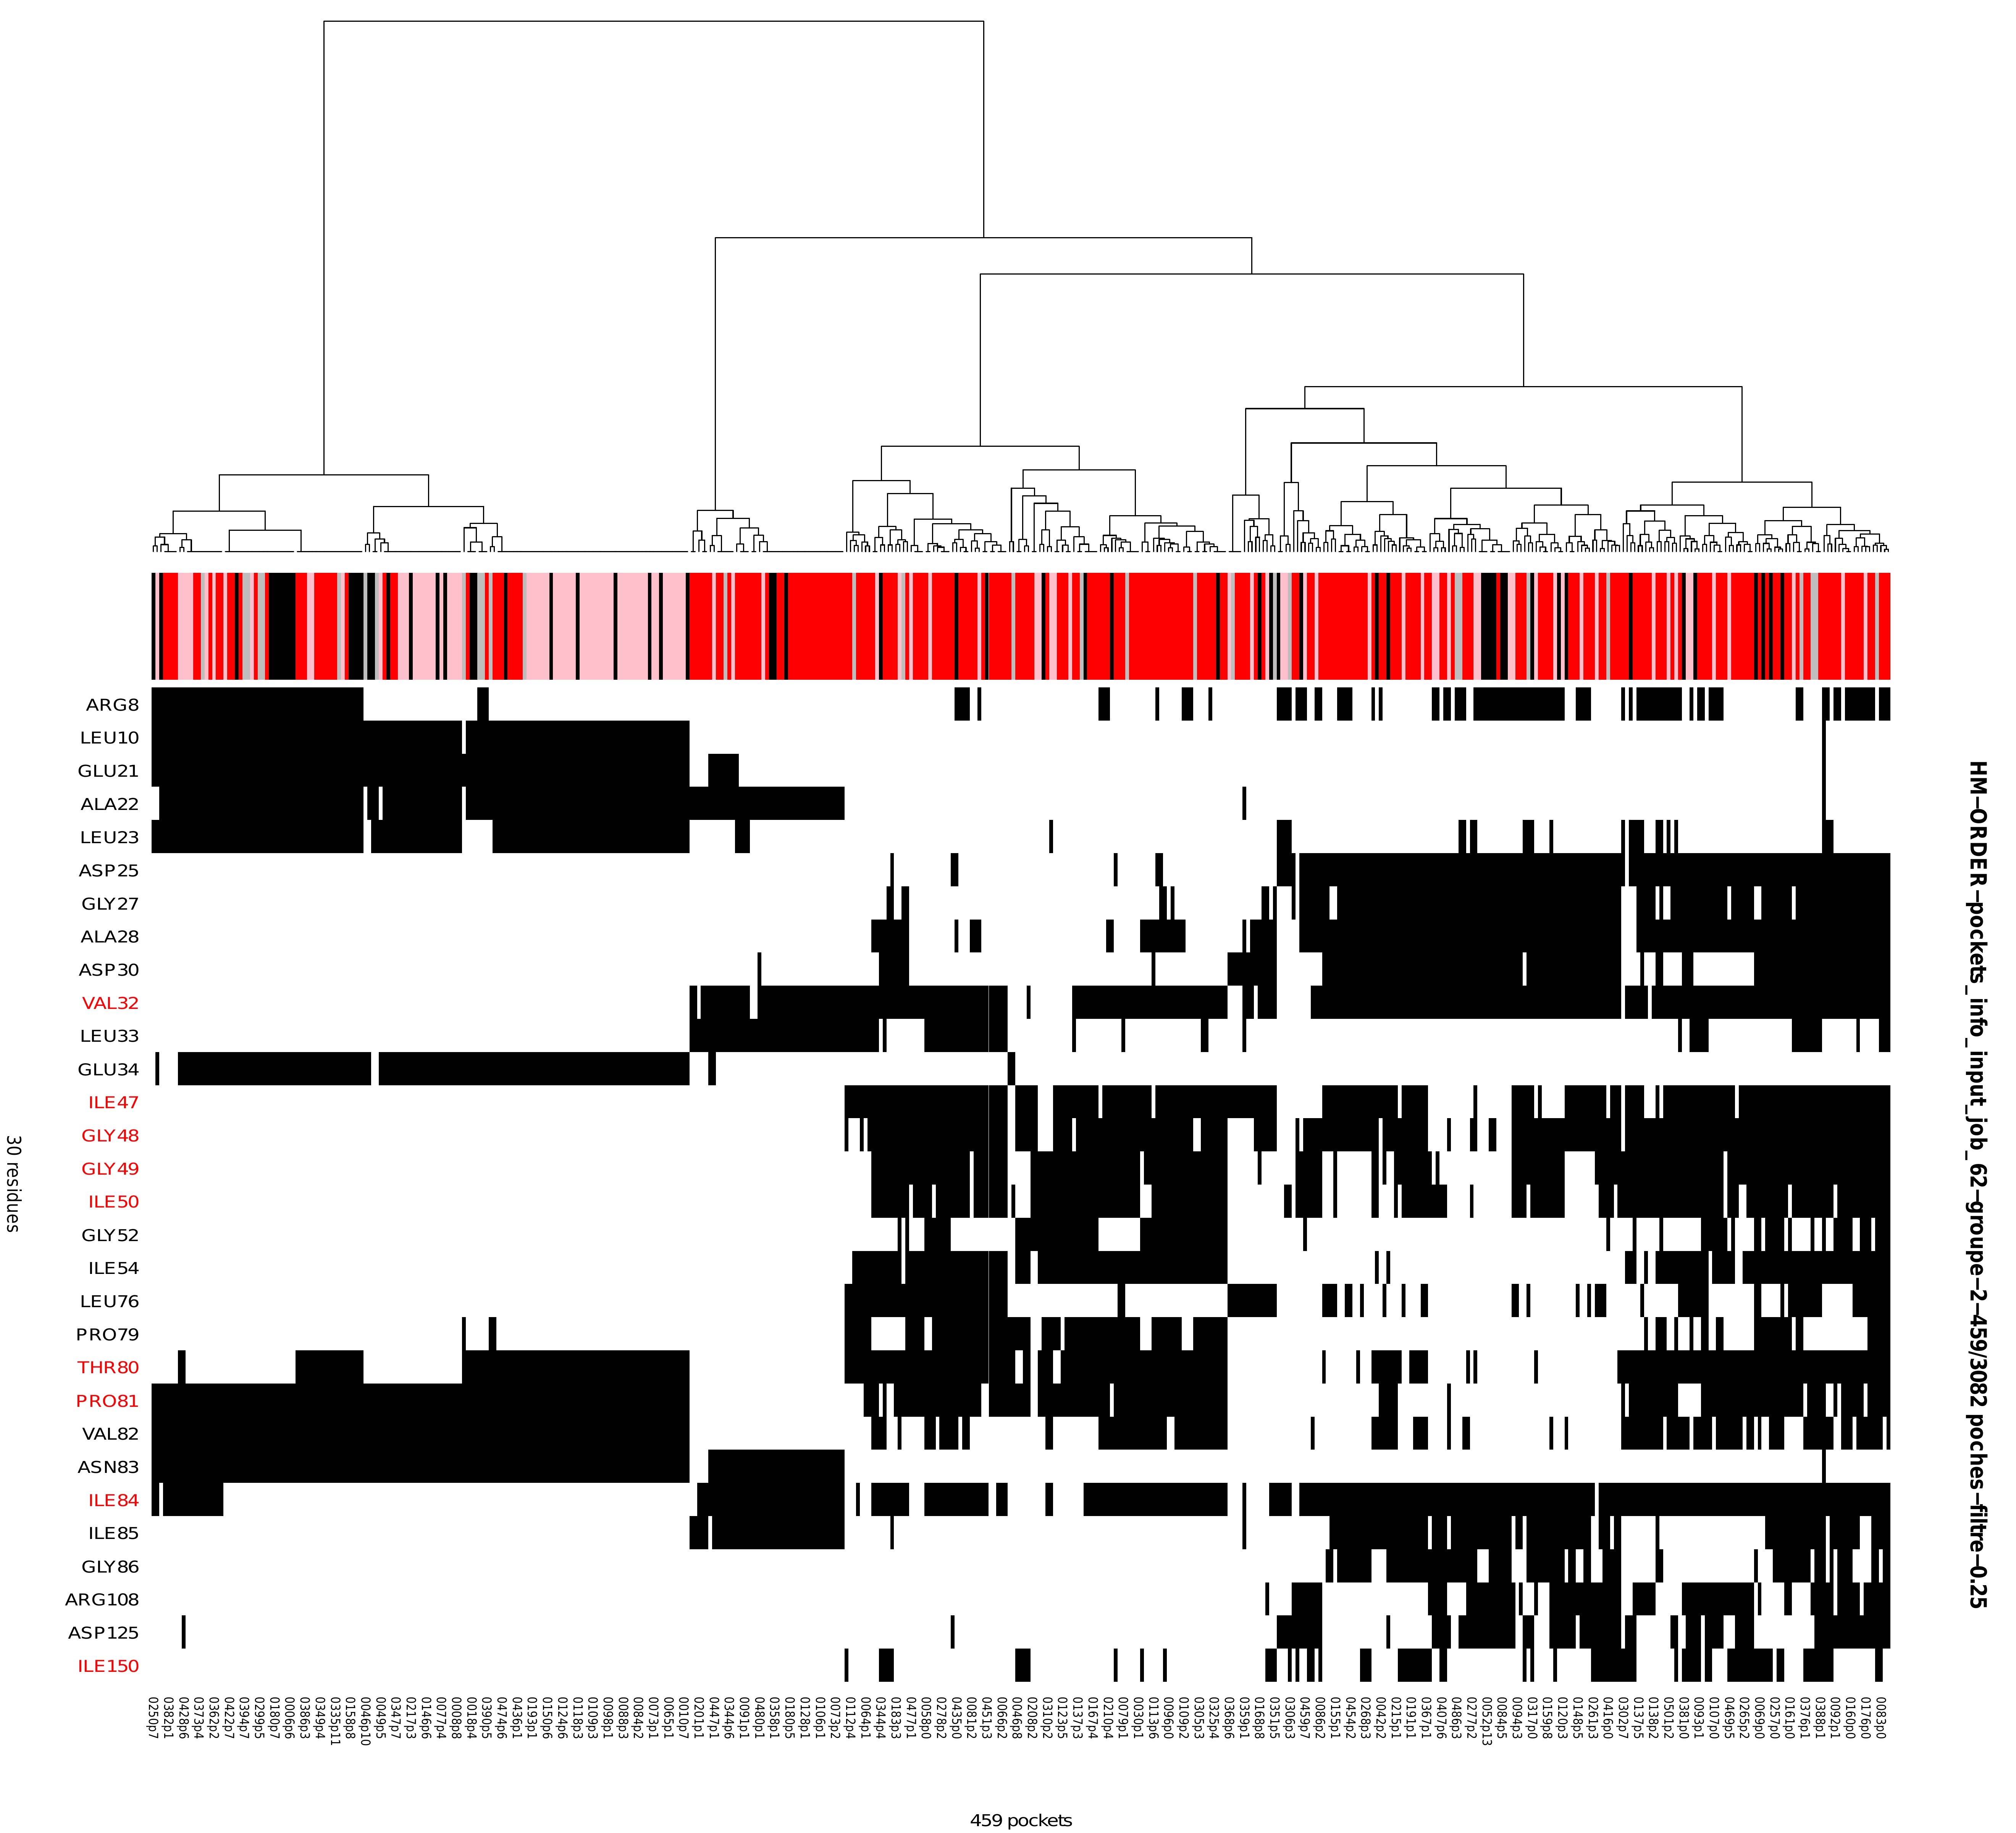
Heatmap: hierarchical clustering and heatmap representation
The heatmap represents pocket–residue associations, with the x-axis corresponding to individual pockets labelled by conformation and pocket index (e.g. 0001p1, indicating pocket 1 in conformation 0001), and the y-axis corresponding to residues. A black cell indicates the presence of the residue listed on the y-axis within the corresponding pocket on the x-axis. Above the heatmap, and directly beneath the dendrogram, an annotation track displays the druggability score associated with each pocket. Druggability values are shown as coloured squares (pink, red, light grey, and grey) and are interpreted according to the druggability legend described in section 6 from the Results viewer panel (Figure 8). Taken together, the dendrogram (top), heatmap (centre), and druggability annotation provide an integrated view of pocket similarity, residue composition, and druggability across the structural ensemble.
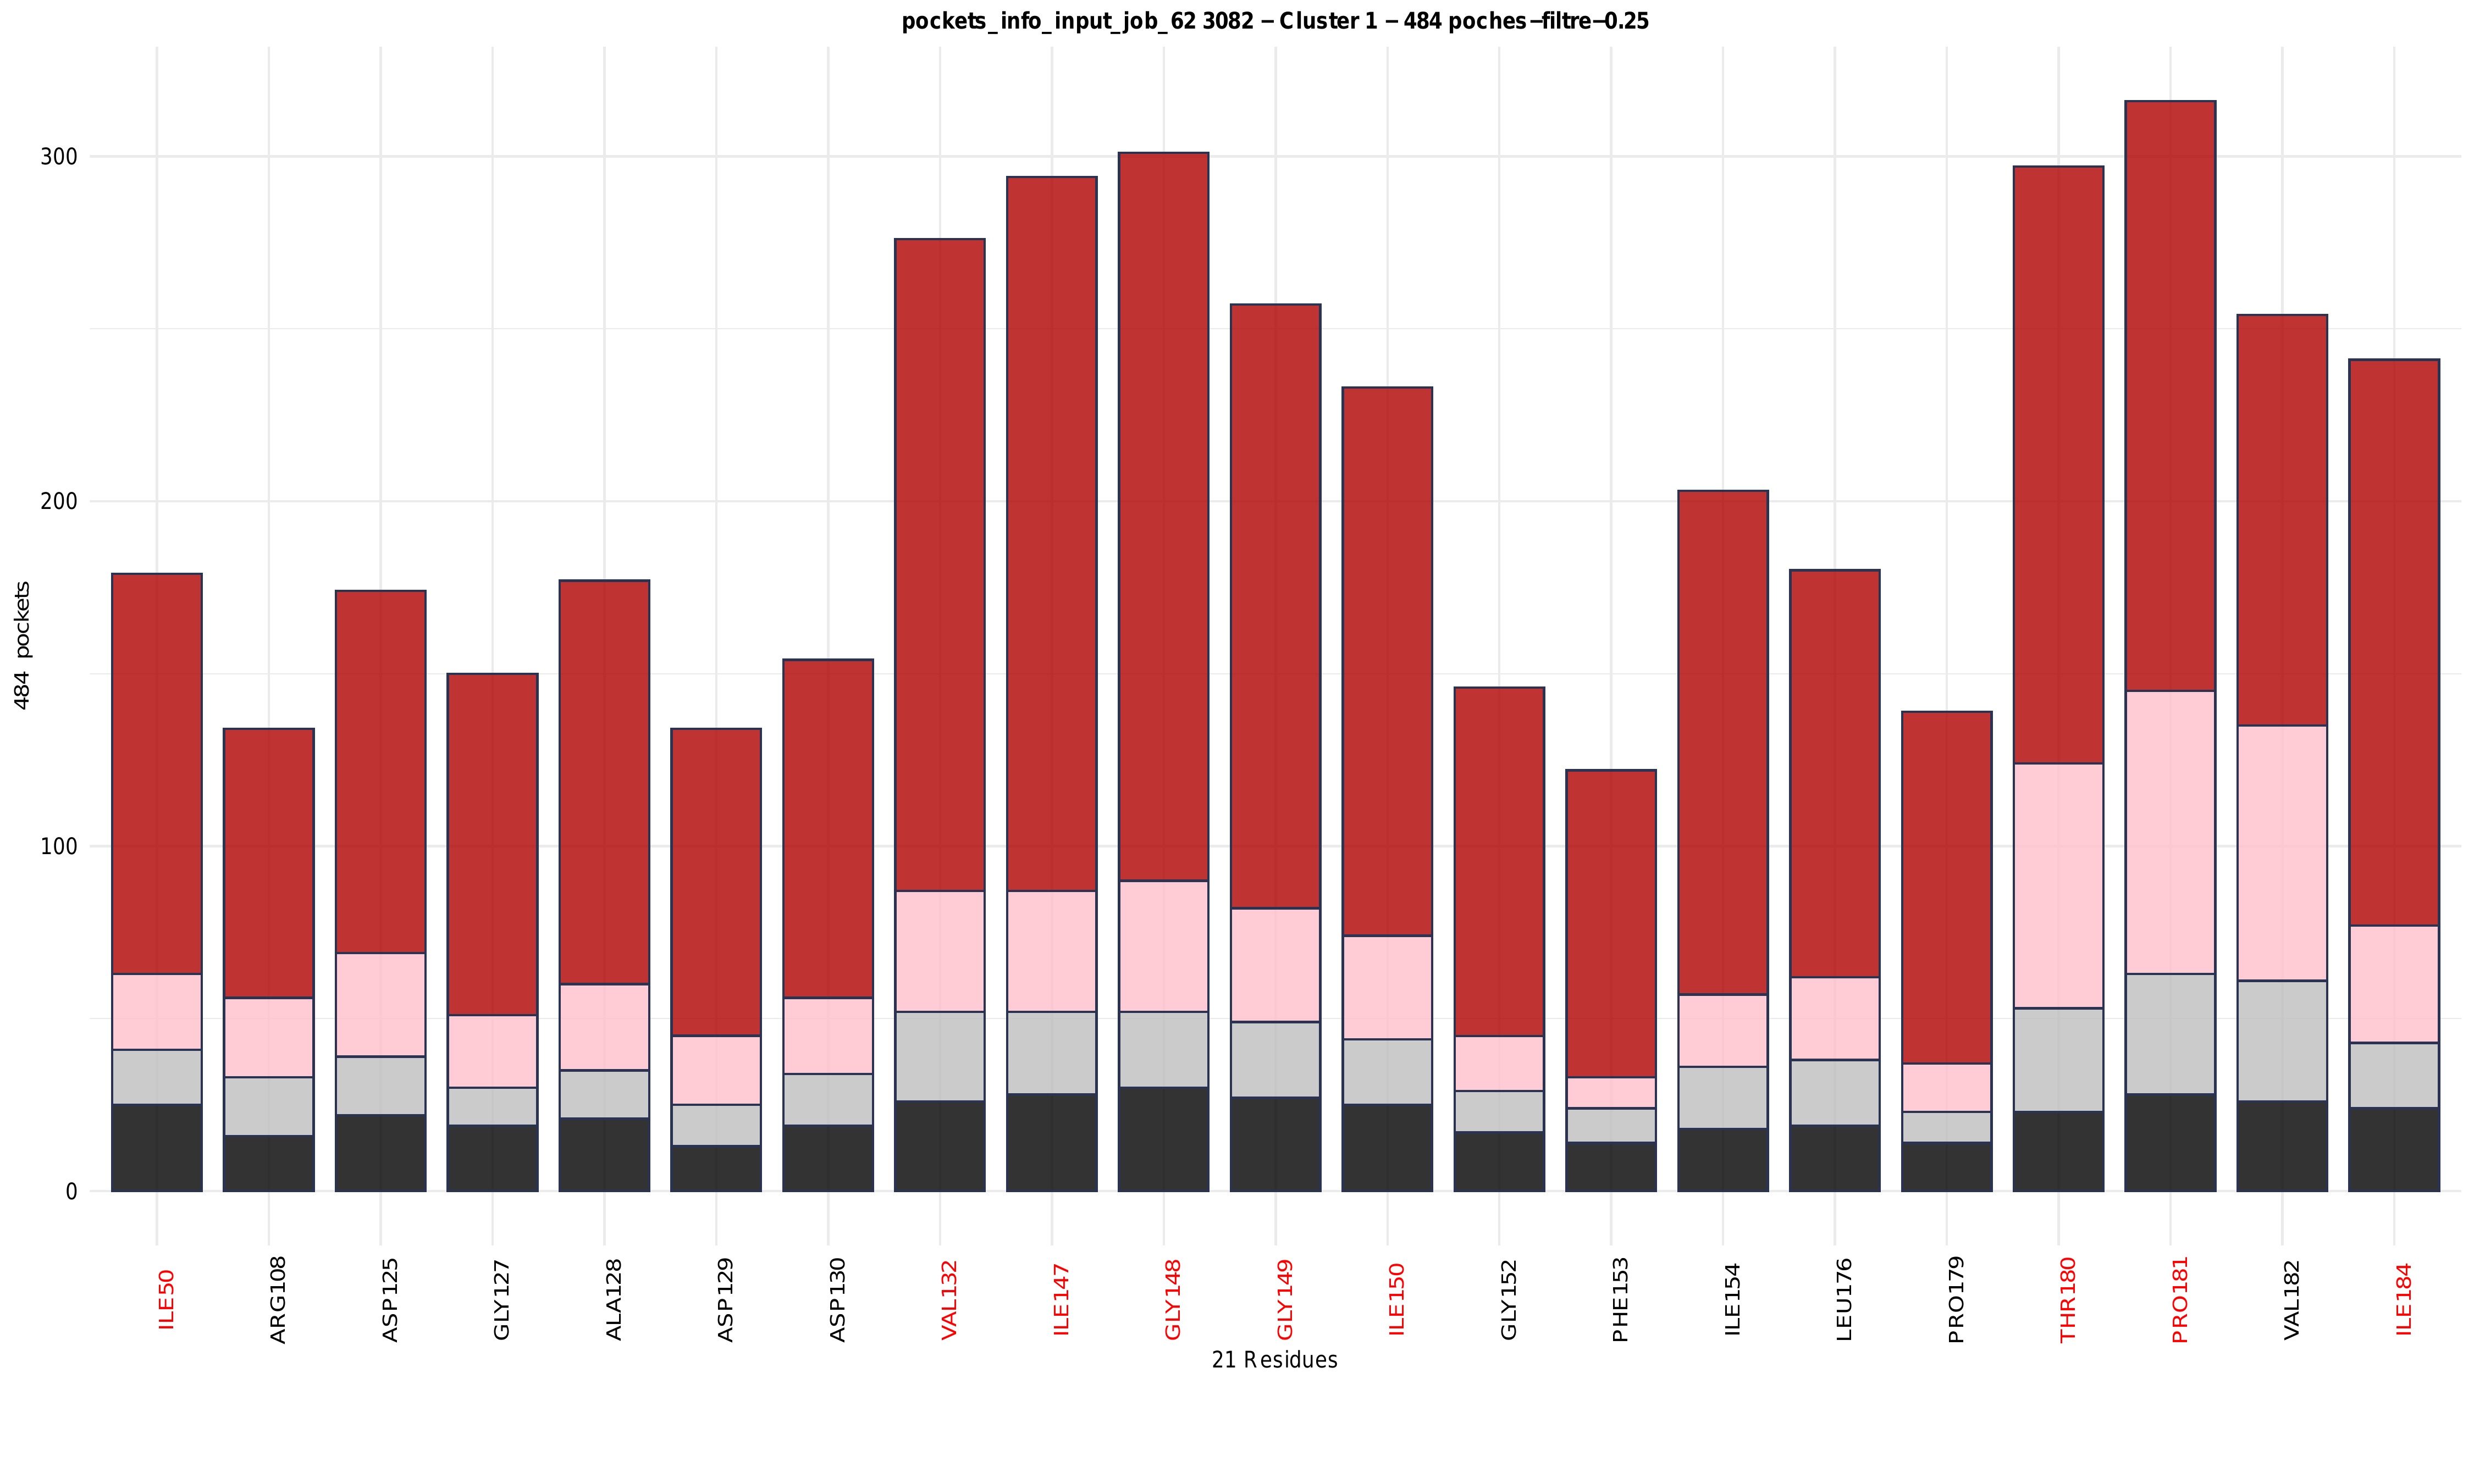
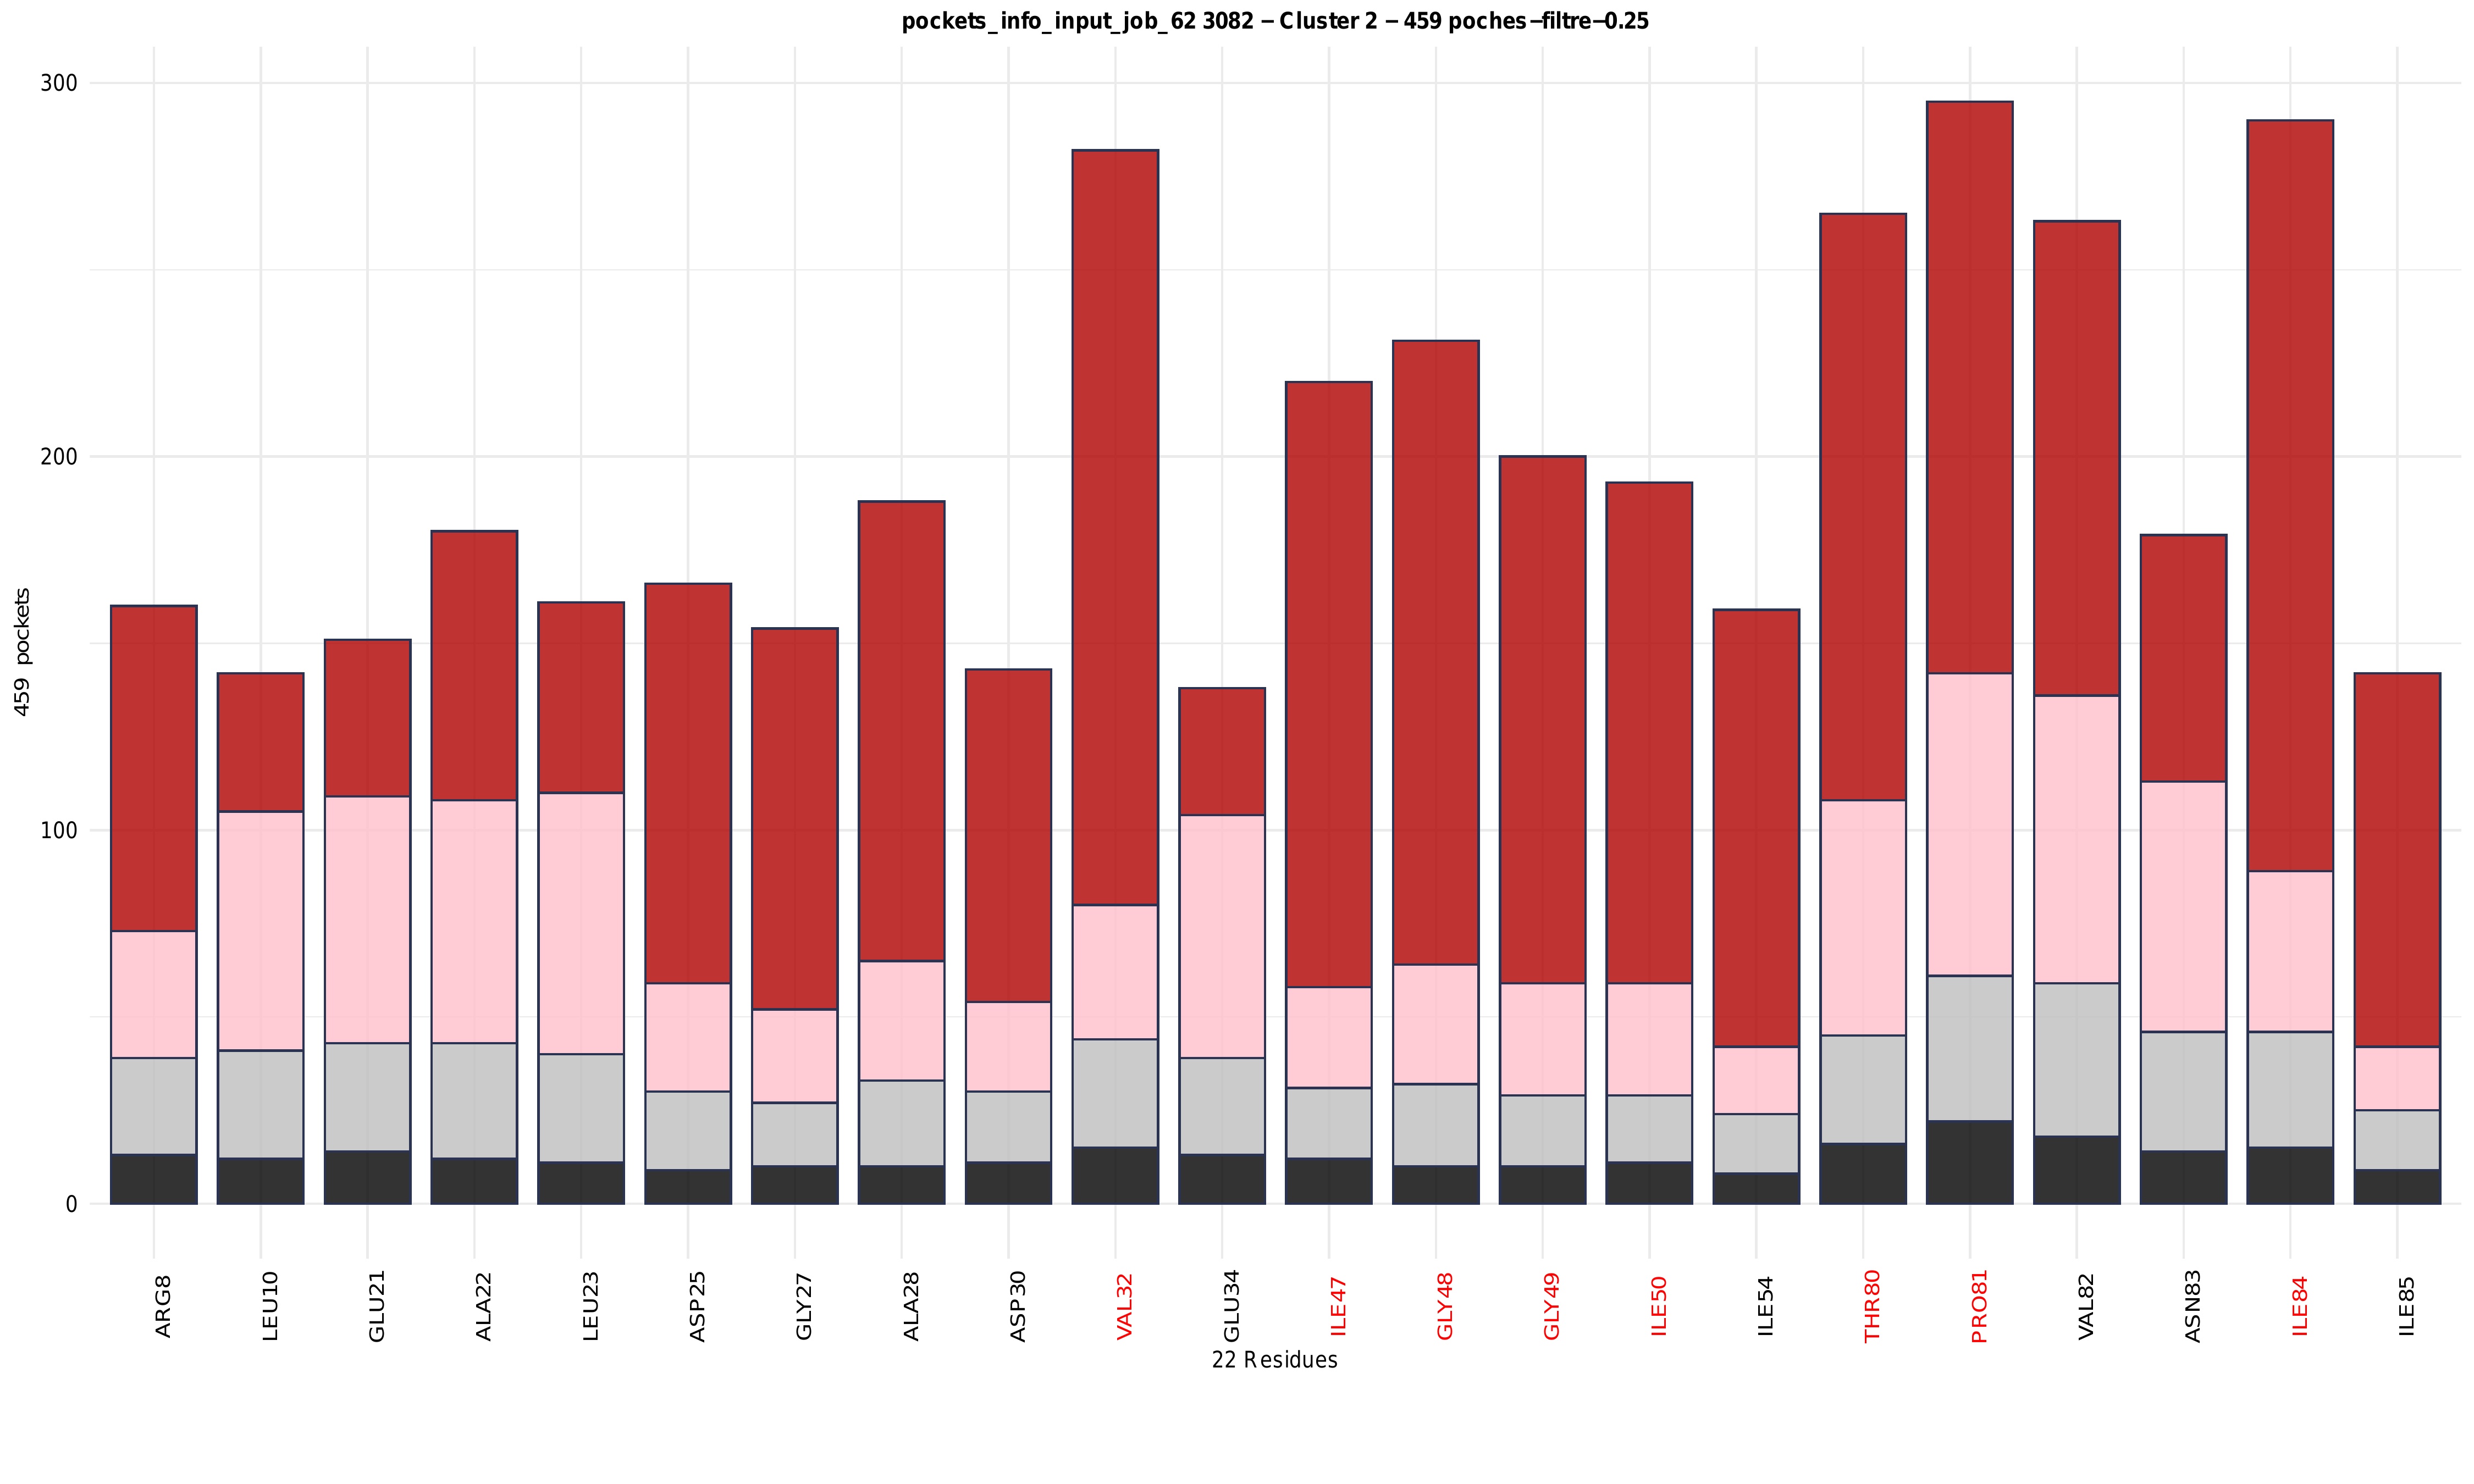
Histogram: residue frequency and druggability distribution within clusters
For each cluster, a stacked histogram summarises the contribution of the most frequent residues across all pockets belonging to that cluster. The x-axis corresponds to residues with residues belonging to the region of interest (ROI) shown in red and all other residues shown in black, while the y-axis represents the number of pockets in which each residue is observed. Bars are colour-coded according to druggability levels, allowing the distribution of druggable and non-druggable pockets associated with each residue to be assessed. This representation highlights residues that are both frequently involved in pocket formation and preferentially associated with druggable pockets, as well as residues contributing mainly to low-druggability environments. Overall, the combination of residue frequency histograms and hierarchical clustering heatmaps enables the identification of conserved versus variable residues, the internal organisation of clusters, and the relationship between structural composition and druggability across pocket ensembles.
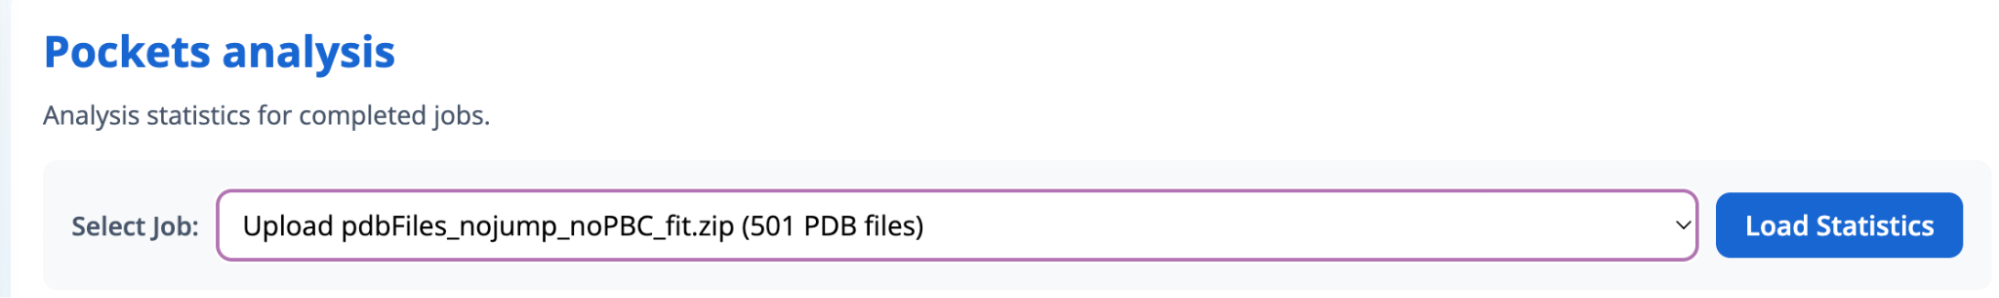
Pockets analysis
In the Pocket analysis section, users must load a completed job each time they wish to analyse results. When a new job is run, its results are not displayed automatically; the corresponding job must be explicitly selected from the list of completed jobs and loaded using the Load Statistics button. All analyses shown in this section are performed on the results associated with the selected job only.
The Pocket analysis interface is organised into two main panels, which provide complementary levels of analysis.
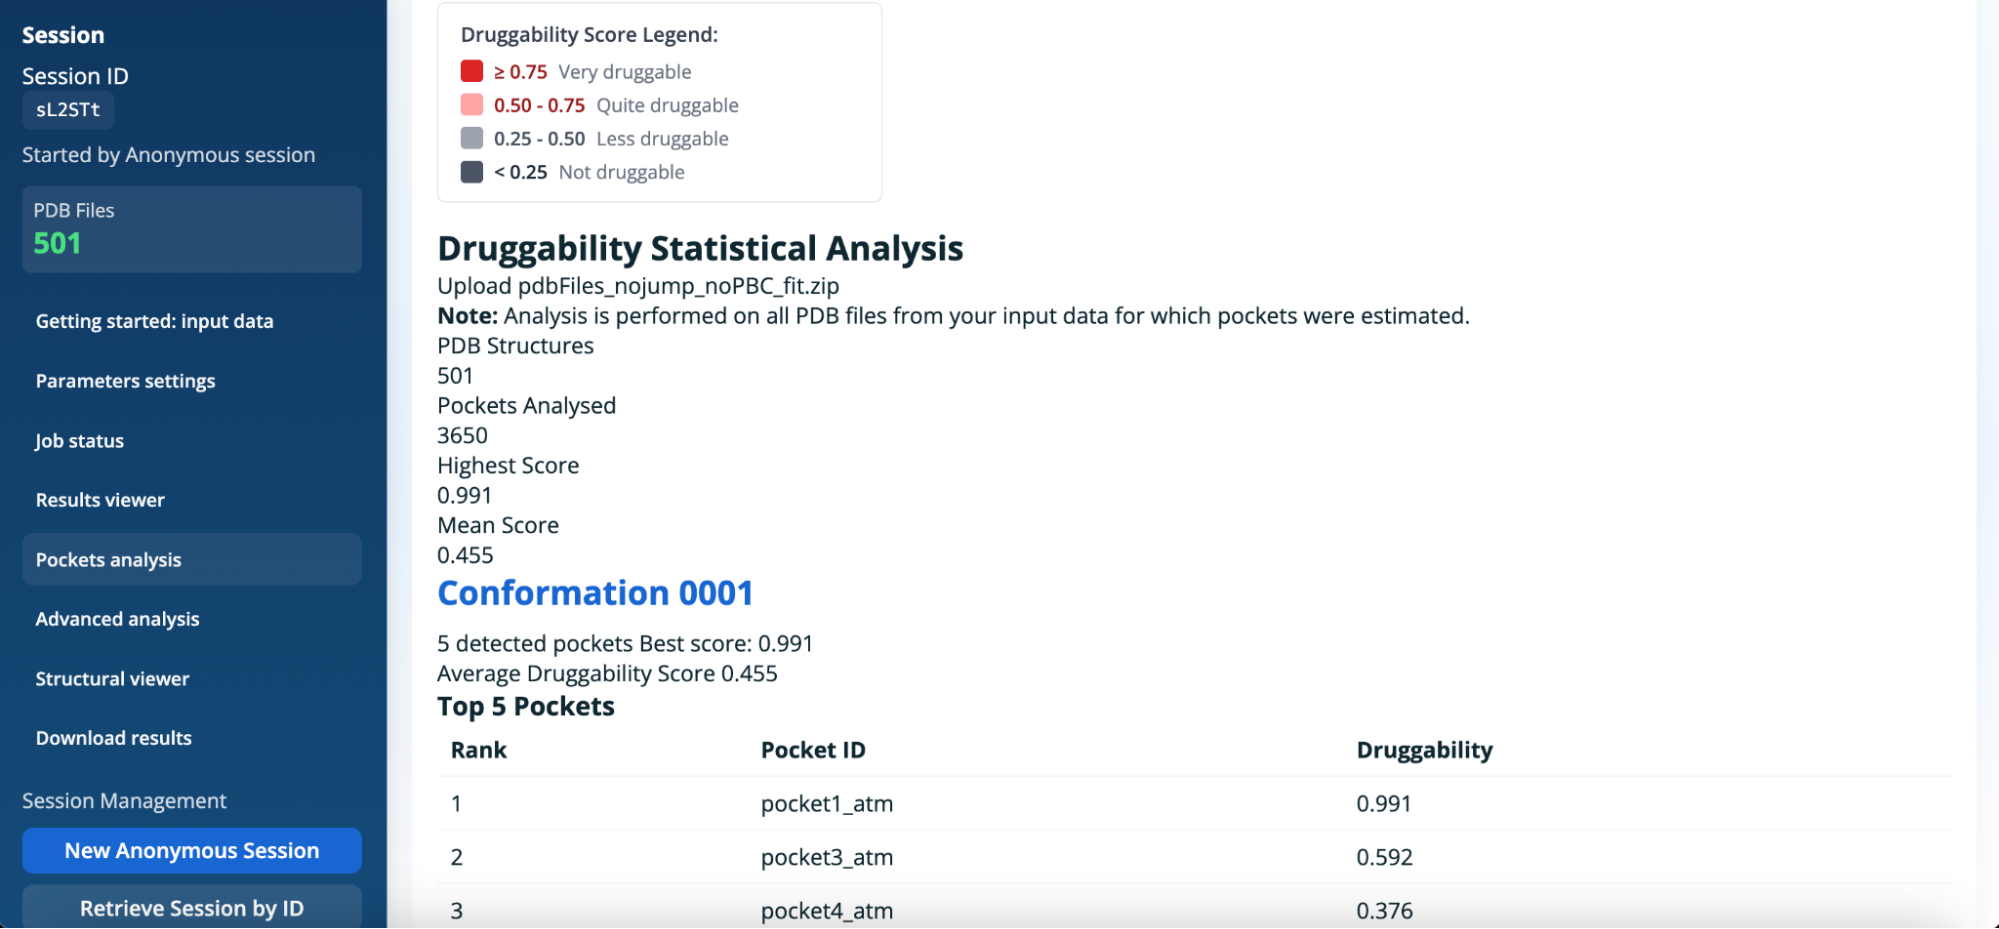
Panel 1: PDB pockets analysis
The PDB pockets analysis panel provides global statistics on pocket detection and druggability across all PDB structures included in the selected job. This panel summarises:
- The total number of PDB structures analysed.
- The total number of detected pockets.
- Druggability scores including the highest and the mean.
For each conformation, detailed information is provided, including:
- The number of detected pockets.
- The best and average druggability scores.
- A ranked list of the top pockets according to their druggability score.
Note : All information in this panel is computed using all PDB files from the input data for which pockets were successfully estimated.
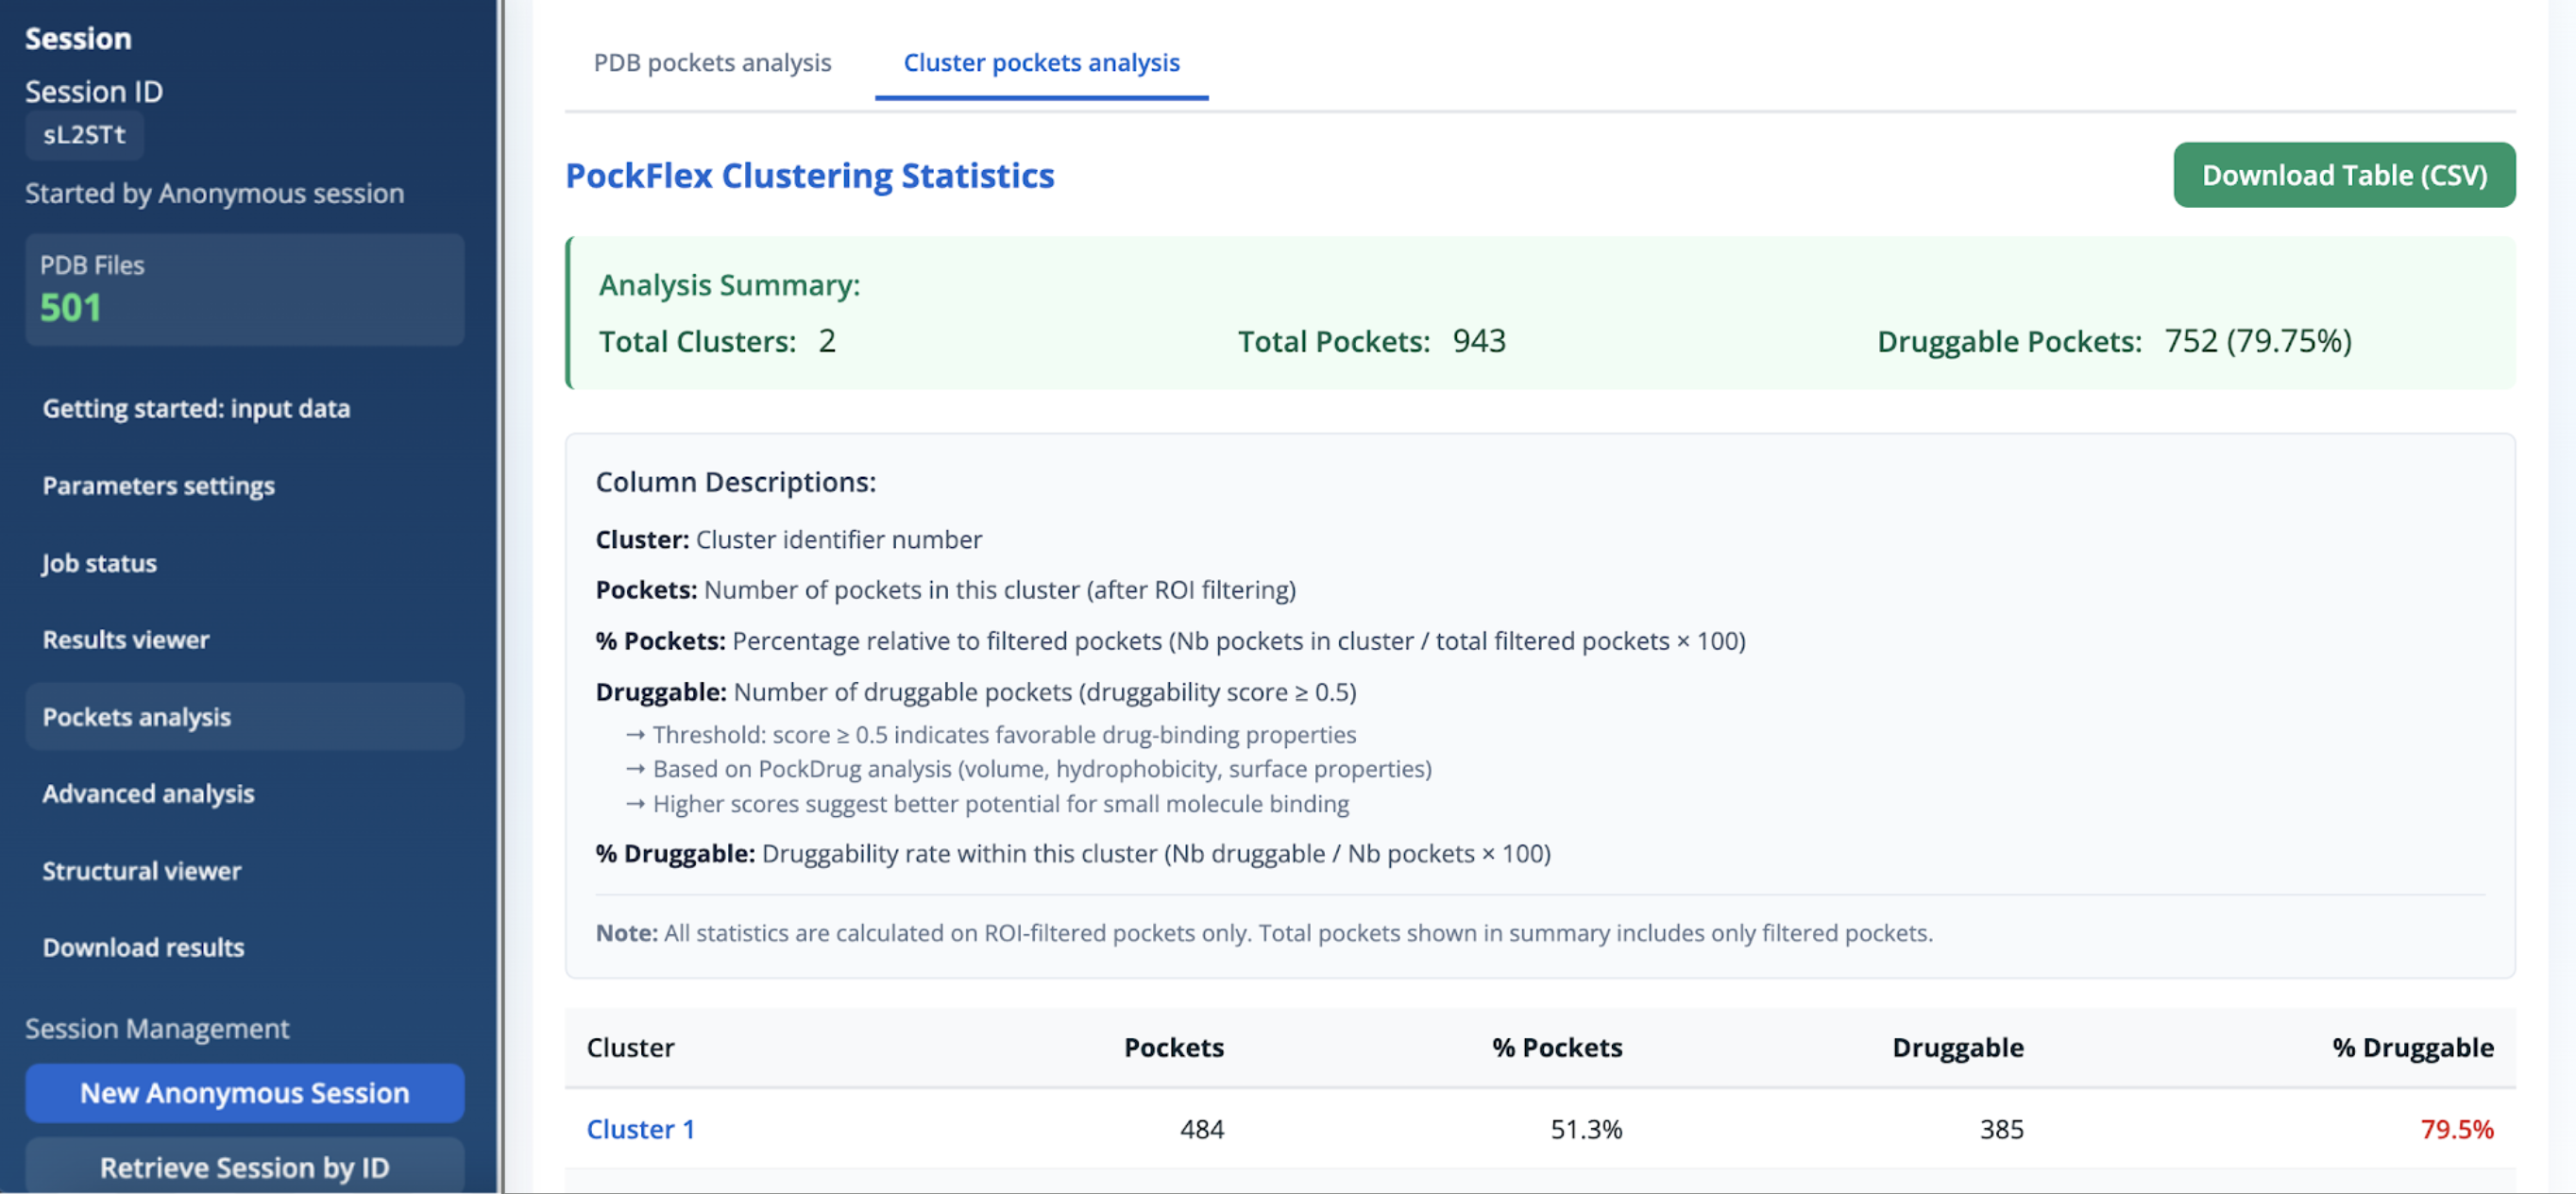
Panel 2: PockFlex clustering statistics
The PockFlex clustering statistics panel provides a cluster-level view of the detected pockets after region-of-interest (ROI) filtering. Results are summarised in a downloadable table (CSV format) and include both global and per-cluster statistics. The analysis summary reports:
- The total number of clusters.
- The total number of pockets retained after ROI filtering.
- The number and proportion of druggable pockets (druggability score ≥ 0.5).
For each cluster, the following quantities are reported:
- Pockets: Number of pockets assigned to the cluster after ROI filtering.
- % Pockets: Percentage relative to the total number of filtered pockets.
- Druggable: Number of druggable pockets within the cluster (druggability score ≥ 0.5).
- % Druggable: Druggability rate within the cluster, defined as the proportion of druggable pockets relative to the total number of pockets in the cluster.
Druggability scores are derived from PockDrug analysis, which combines geometric and physicochemical descriptors such as pocket volume, hydrophobicity, and surface properties. Higher scores indicate a greater potential for binding drug-like molecules. Note: All information reported in this panel is calculated exclusively on ROI-filtered pockets, and the totals shown in the summary correspond only to this filtered subset.
Downloadable table (CSV):
This table summarises the main statistics for each pocket cluster after region-of-interest (ROI) filtering, together with overall totals.
- Cluster: identifier of the pocket cluster obtained from the clustering analysis.
- Pockets: number of pockets assigned to the cluster after ROI filtering.
- % Pockets: proportion of pockets in the cluster relative to the total number of filtered pockets.
- Druggable: number of druggable pockets in the cluster, defined as pockets with a druggability score ≥ 0.5.
- % Druggable: druggability rate within the cluster, defined as the percentage of druggable pockets relative to the total number of pockets in that cluster.
- Mean Dist: mean intra-cluster distance, reflecting the average dissimilarity between pockets within the cluster. Lower values indicate more structurally homogeneous clusters.
- Var Dist: variance of intra-cluster distances, reflecting the structural heterogeneity within the cluster.
In this example, Cluster 1 contains fewer pockets (133, ~17% of all filtered pockets) and exhibits a relatively low druggability rate (33.83%), together with low mean and variance of intra-cluster distances, indicating a compact and homogeneous cluster. By contrast, Cluster 2 contains the majority of pockets (651, ~83%) and shows a high druggability rate (79.26%), together with higher mean and variance of distances, indicating greater structural diversity. The Total row reports global statistics across all ROI-filtered pockets, including the total number of pockets, the total number of druggable pockets, and the overall mean and variance of distances.
Advanced analysis
In the Advanced analysis section, users must load a completed job each time they wish to analyse results. When a new job is run, its results are not displayed automatically; the corresponding job must be explicitly selected from the list of completed jobs and loaded using the Analyse Key Residues button. All information shown in this section is performed on the results associated with the selected job only.
This analysis lists residues that appear in the pockets within each cluster. For each cluster, the total number of pockets and the number of residues meeting a chosen frequency threshold are reported.
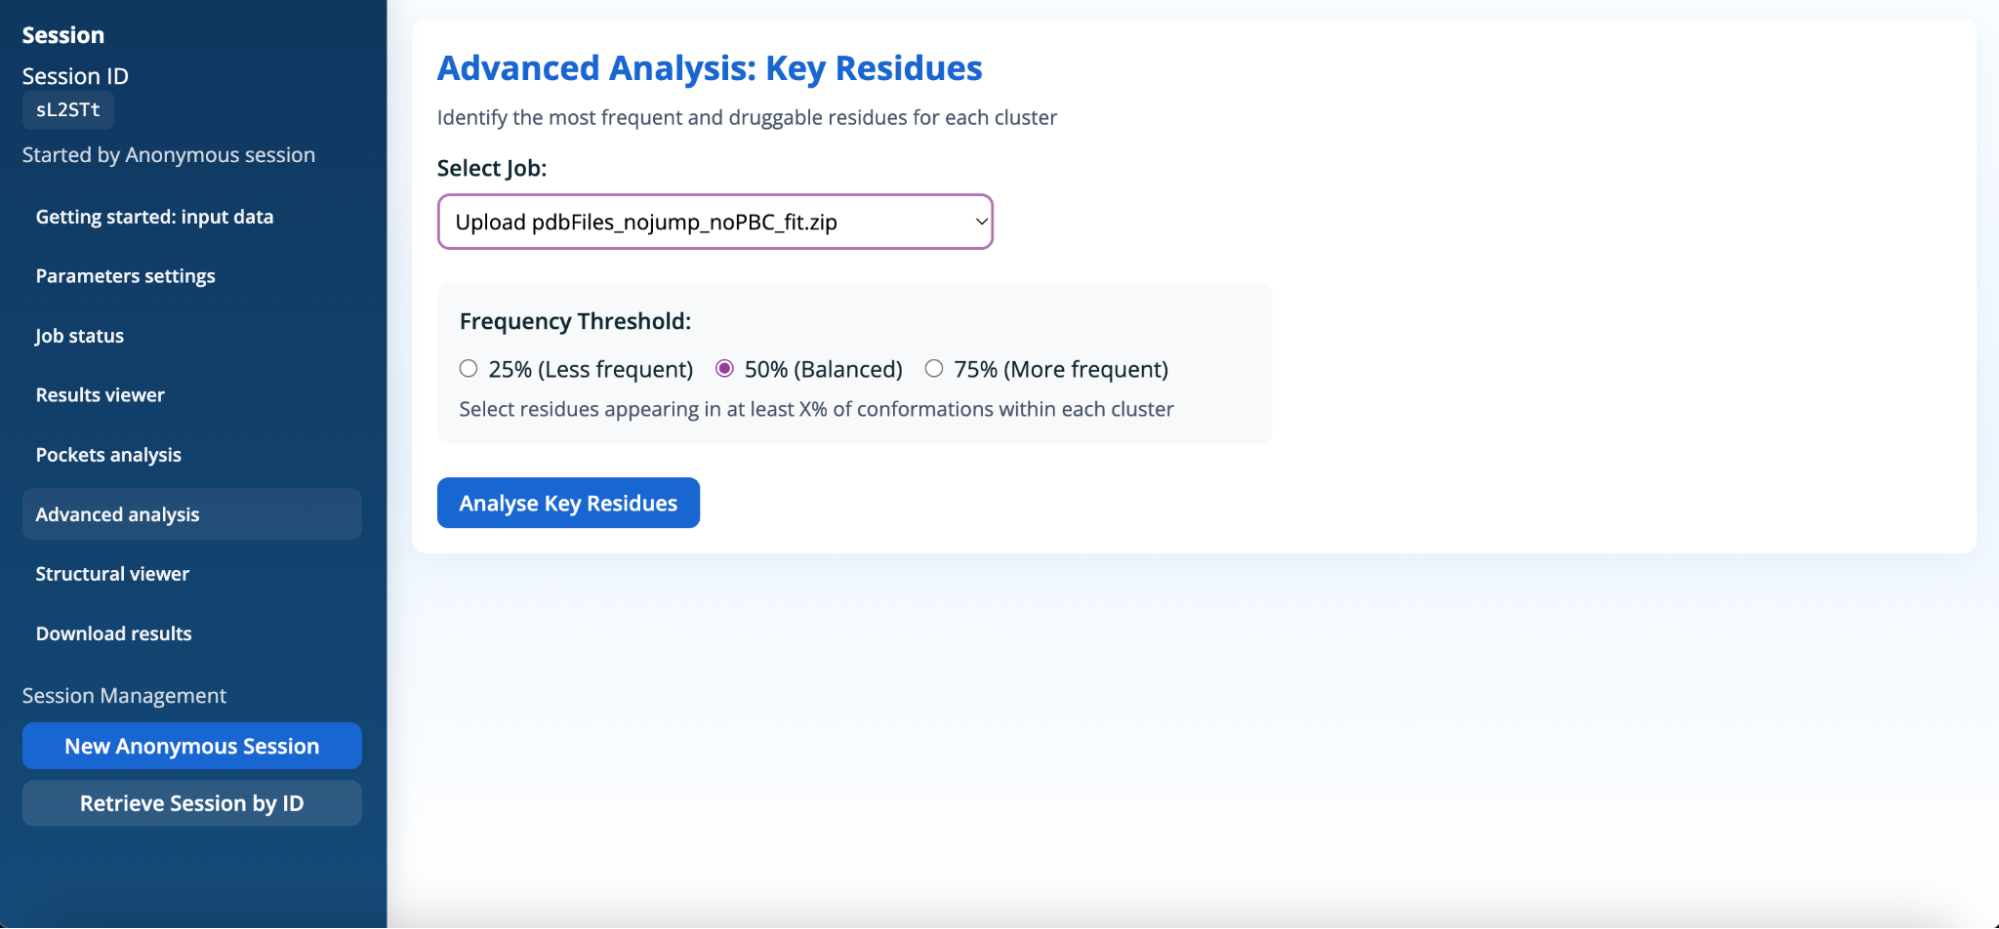
The frequency threshold defines the minimum proportion of conformations in which a residue must be present to be considered significant within a given cluster. Adjusting this threshold enables users to focus either on highly conserved residues or to explore more variable and transient ones. Available options are:
- 25% (Less frequent): selects residues that appear in at least 25% of conformations within a cluster, including less frequent or transient contributors.
- 50% (Balanced): selects residues present in at least half of the conformations, providing a balanced view between conserved and variable residues.
- 75% (More frequent): selects only highly frequent residues shared by most conformations within a cluster, emphasising conserved structural features.
By adjusting this threshold, users can refine the key residues analysis to explore different levels of residue conservation within pocket clusters and better understand the relationship between residue persistence and pocket druggability.
For each residue, the table provides:
- the residue name and chain,
- the number of pockets in which the residue is observed (Appearances),
- the corresponding frequency expressed as a percentage of pockets within the cluster,
- the distribution of these appearances across druggability classes, ranging from non-druggable (d < 0.25) to very druggable (d ≥ 0.75).
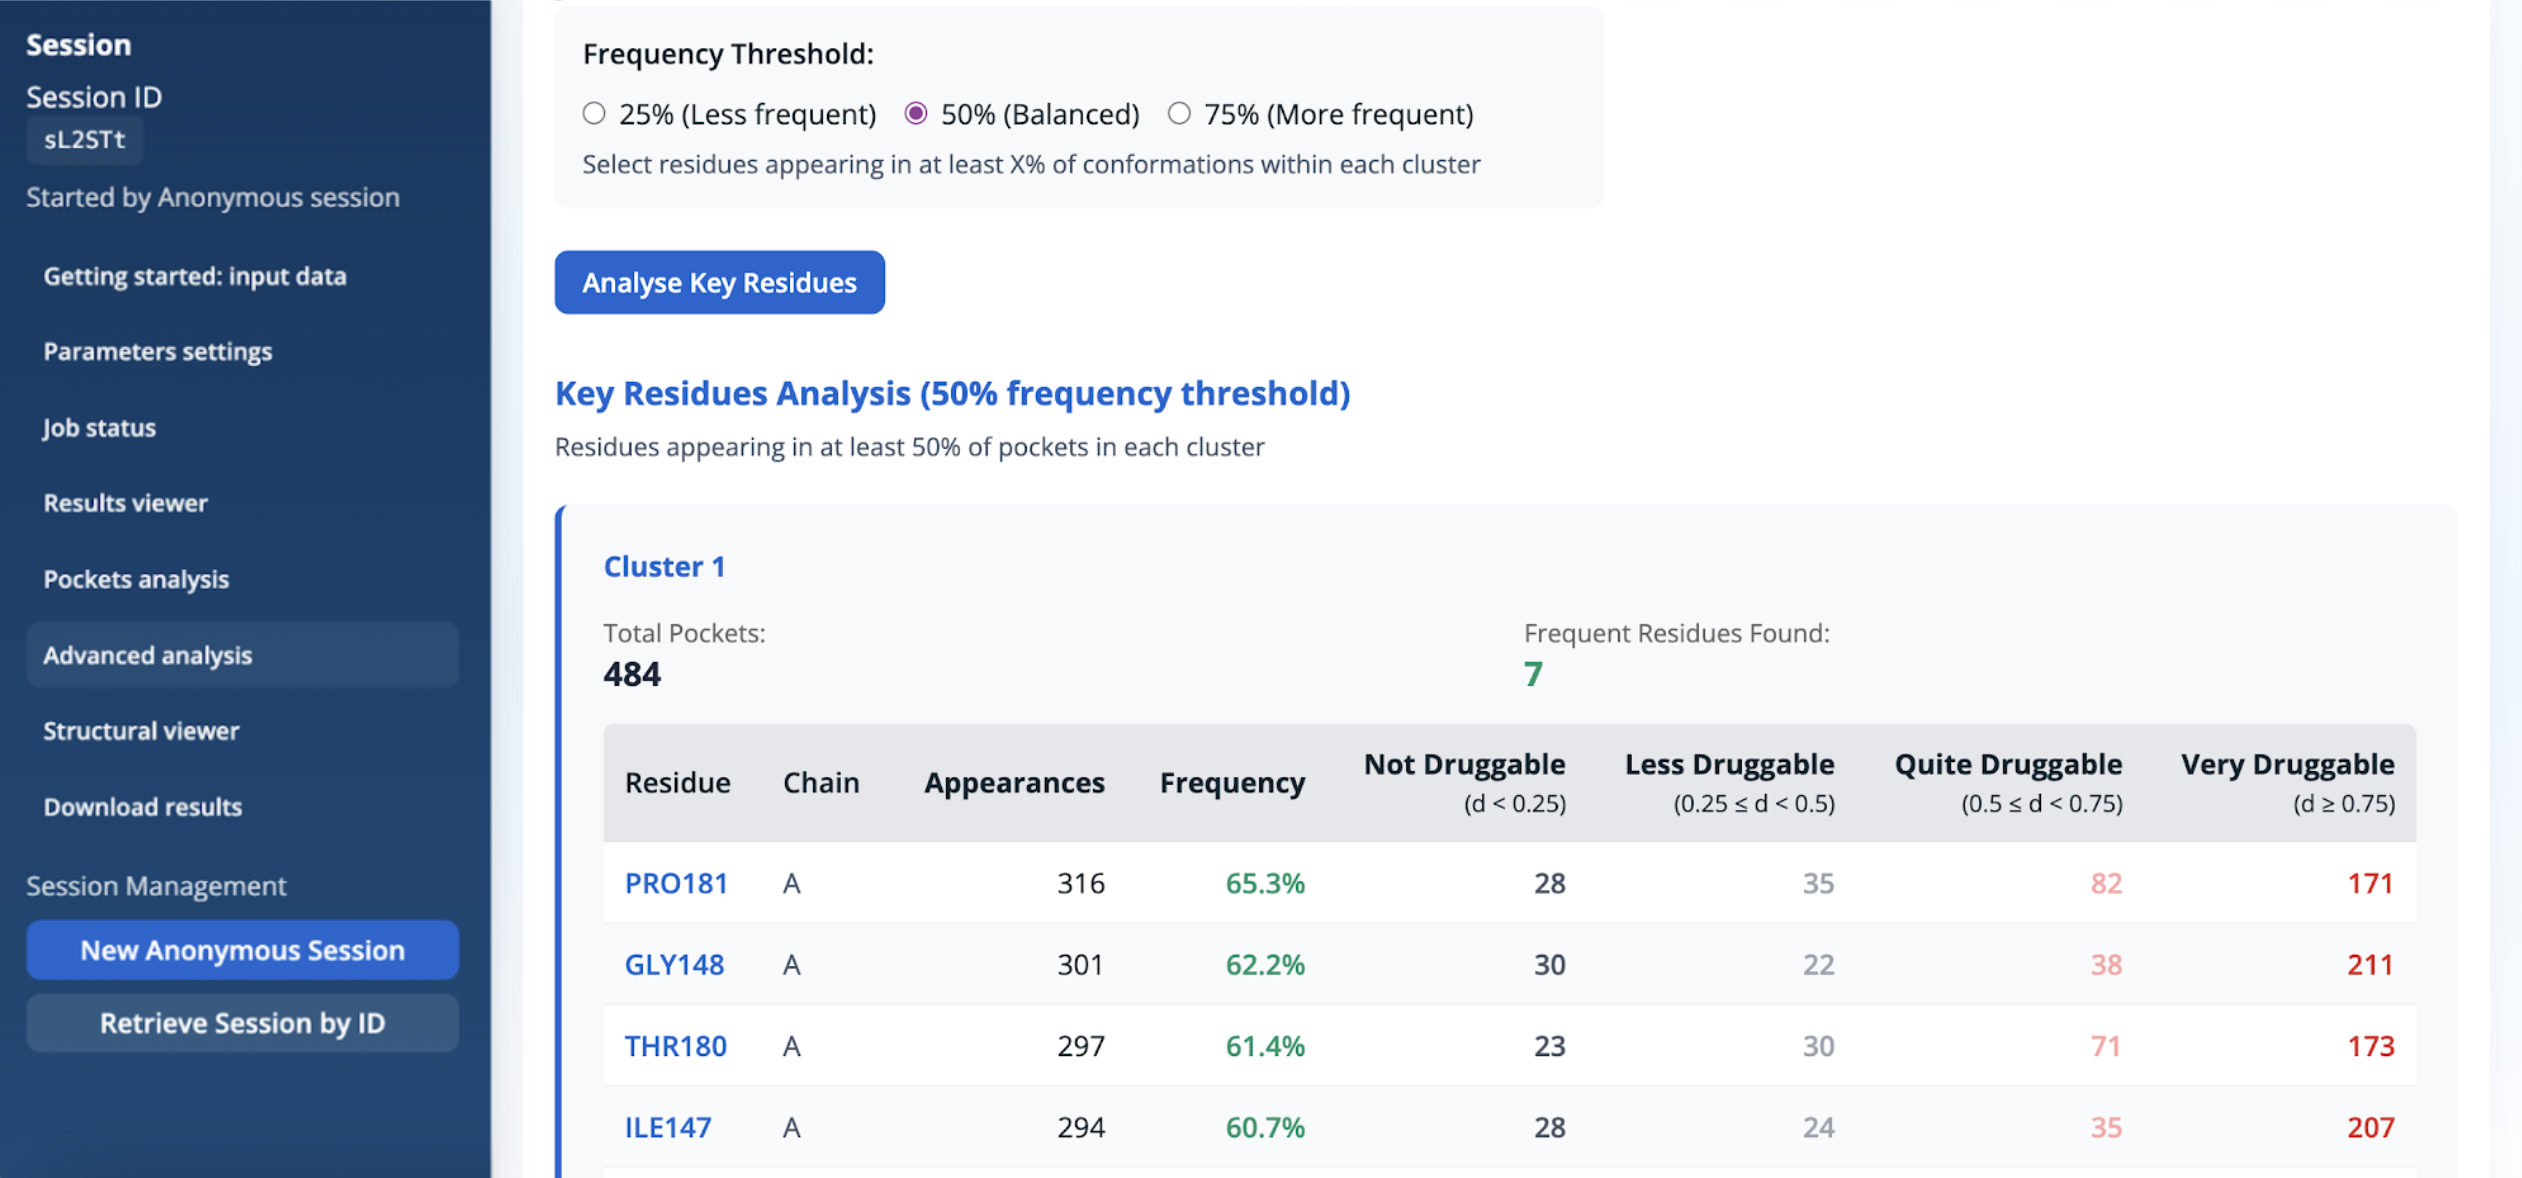
Results are reported separately for each cluster, allowing residue-level frequency information to be examined alongside the druggability classification of the associated pockets. This panel allows users to control the selection of key residues within each pocket cluster based on their frequency of appearance across pocket conformations. It provides a filtered view derived from the residue frequency and druggability distribution histograms described above (Figure 14 and Figure 15).
Structural viewer
This panel allows users to visualise pockets from PockFlex clusters in three dimensions.
Users must first select and load a completed PockFlex job, then choose a cluster to display. Once the structure is loaded, the viewer provides interactive controls to explore the spatial organisation of the protein and the selected pocket.
The panel offers the following functionalities:
- Selection of a completed job and cluster for visualisation.
- Loading and resetting of the 3D structure.
- Focusing on the selected pocket.
- Independent display of the pocket and the full protein.
- Access to basic cluster information.
- Upload of custom PDB files for both the protein and the pocket.
- Selection of visualisation styles (e.g. cartoon representation).
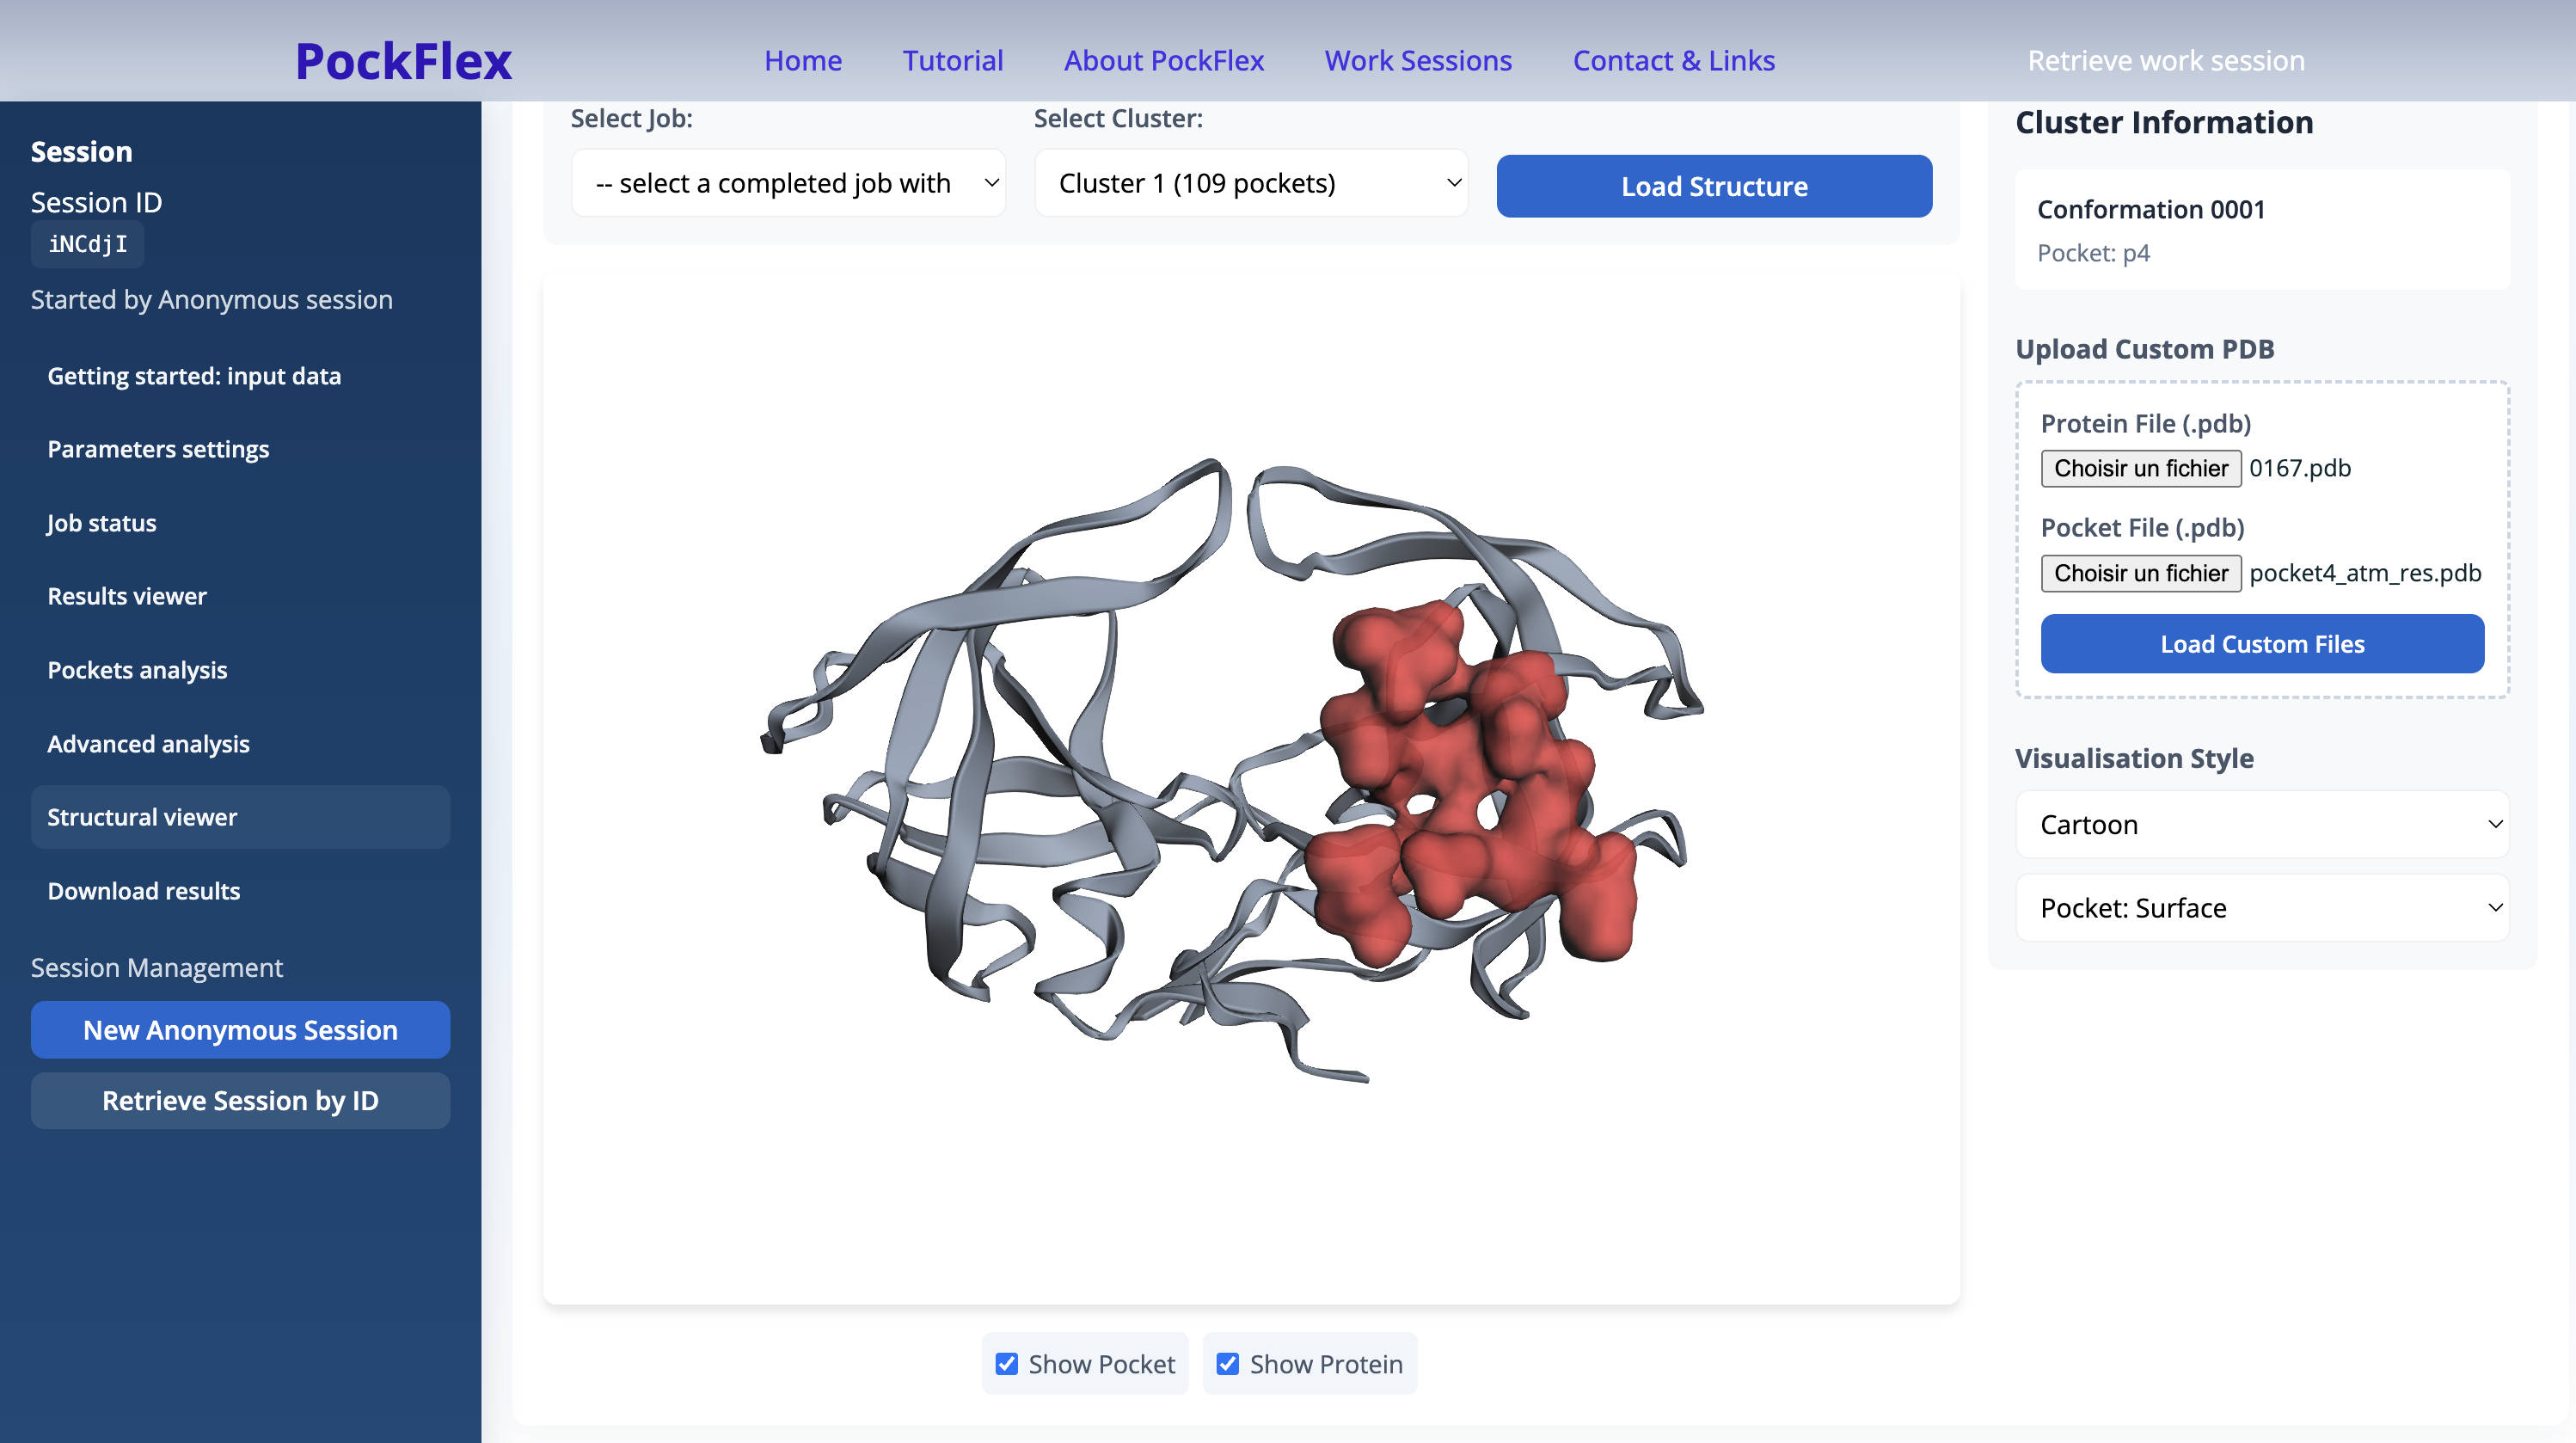
This viewer enables direct inspection of pocket localisation and geometry within the protein structure, complementing the cluster-level and statistical analyses provided elsewhere in the interface.
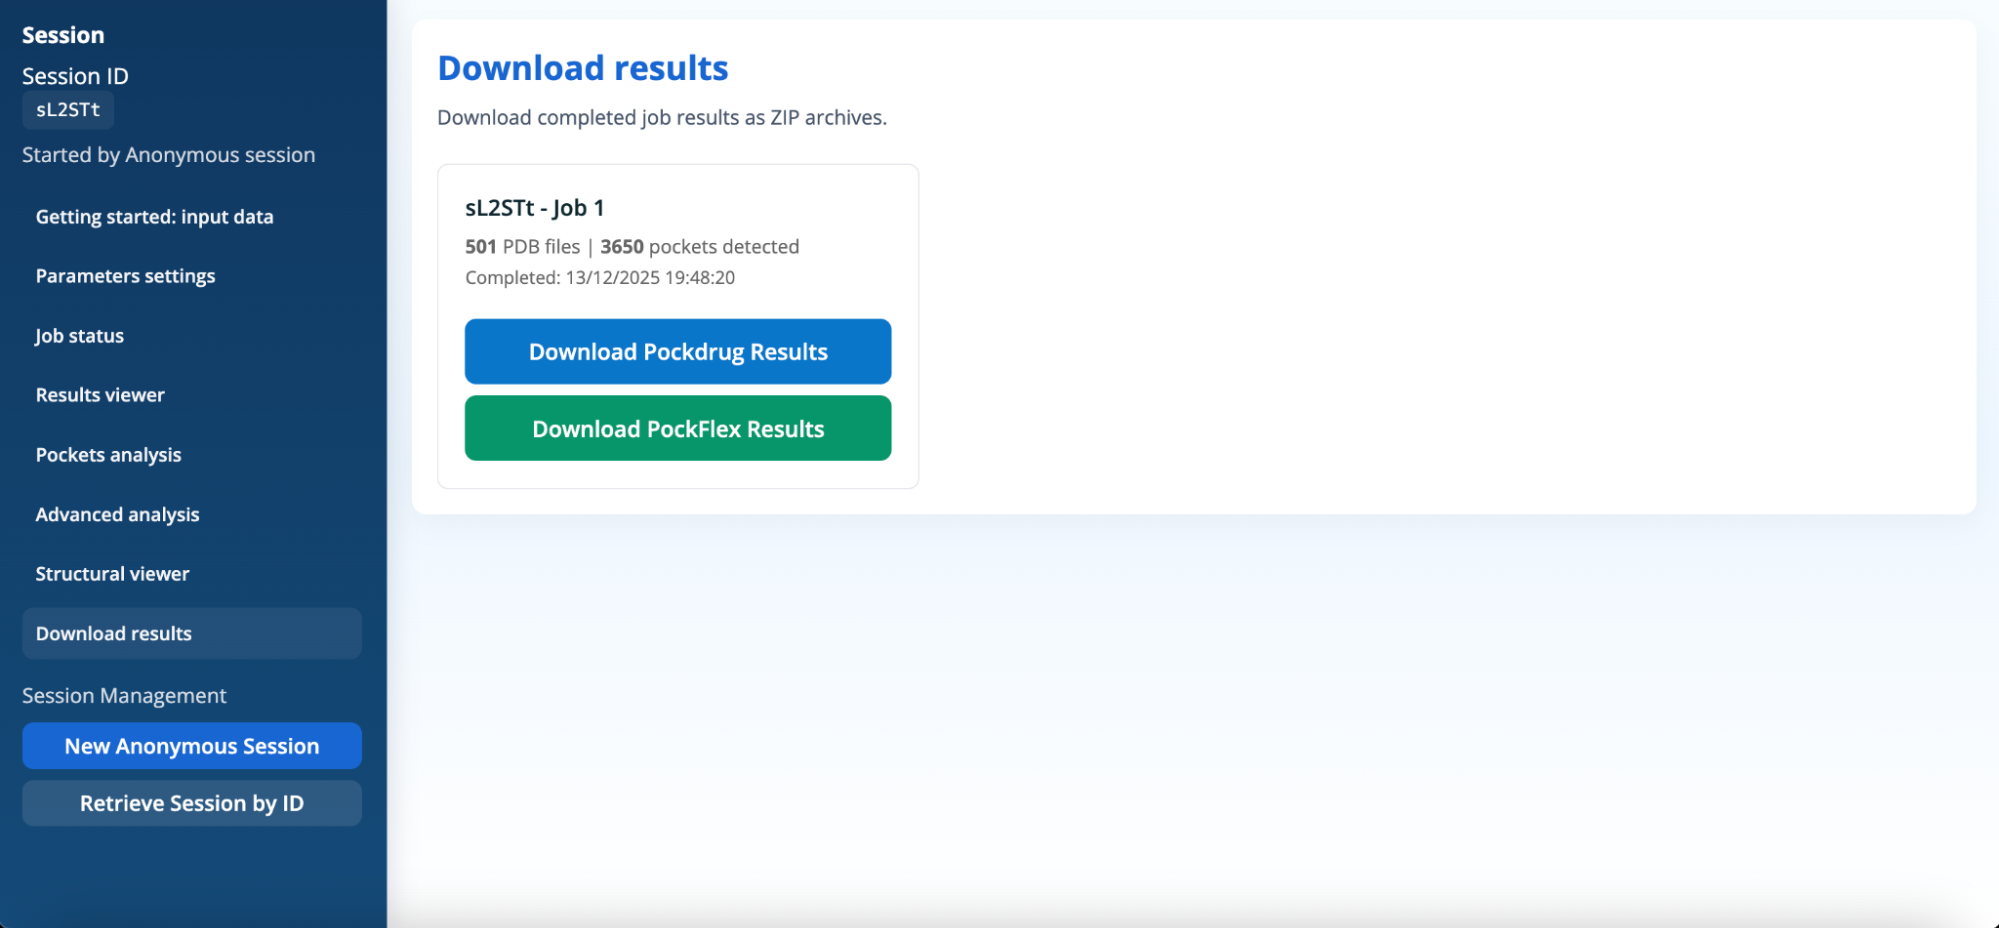
Download results
For each completed job, the panel displays:
- the job identifier and name,
- the number of PDB structures analysed,
- the total number of detected pockets,
- the job completion date and time.
Two download options are available:
- Download PockDrug Results, which provides pocket-level druggability analyses,
- Download PockFlex Results, which provides the figures from the Results viewer panel